Preview image. Unlock full-res
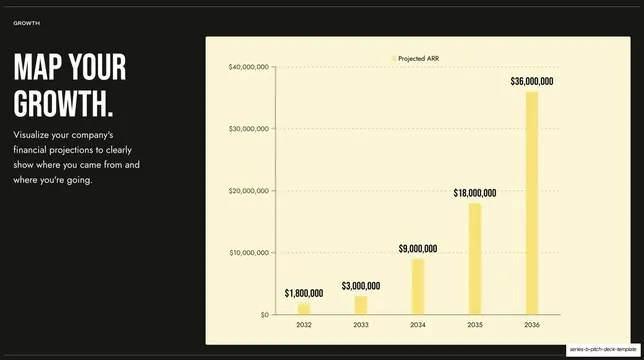
Growth slide pairing a left headline and body copy with a large cream panel holding a yellow ARR bar chart climbing from $1.8M to $36M.
Summary
A growth slide: a short headline plus instruction copy on the left, against a large cream panel with a yellow bar chart of projected ARR rising from $1.8M (2032) to $36M (2036).
Visual description
A near-black slide with a "GROWTH" utility label on a hairline rule at top left. The left third stacks a two-line oversized condensed all-caps headline in white, "MAP YOUR GROWTH.", and four lines of smaller light body copy ("Visualize your company's financial projections to clearly show where you came from and where you're going."). The right two-thirds is a large cream rounded panel holding a vertical bar chart: five yellow bars across years 2032 to 2036, climbing in a near-hockey-stick curve, each capped with a bold dark dollar value ($1,800,000, $3,000,000, $9,000,000, $18,000,000, $36,000,000). The y-axis is gridded in dashed lines up to $40,000,000 and a small "Projected ARR" legend sits at the top.
Key takeaway
The split of a short, confident headline plus one explanatory sentence against a single large chart panel, which keeps a data slide from feeling cluttered. Labeling every bar with its exact value above the bar removes the need to read against the axis, and keeping the bars in the one accent yellow ties the chart to the rest of the deck.
Reuse notes
A reusable financials or growth-projection layout for a fundraising deck, ideal for an ARR or revenue ramp. The figures are placeholders meant to show a hockey-stick trajectory. The bright cream chart panel depends on the dark ground for contrast; on-bar value labels work best with five or fewer bars.
From this deck: Growth projections bar chart
View deck


More like this






Keep what you find
A free account saves references to boards and can send you a weekly email of picks based on what you save.
To see every result, go Pro.