Preview image. Unlock full-res
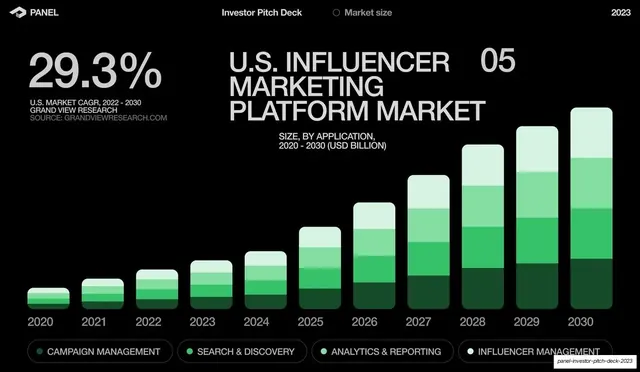
Dark market-size slide with a giant 29.3% CAGR stat at top-left and a rising green stacked-bar chart from 2020 to 2030 with a four-item legend.
Summary
The Market Size slide: a huge "29.3%" CAGR figure at top-left and a rising green stacked-bar chart of the U.S. influencer marketing platform market from 2020 to 2030, with a four-segment legend.
Visual description
Near-black background, running header with a "Market size" label. At top-left, "29.3%" is set very large in light gray, with small all-caps source text beneath (U.S. market CAGR 2022-2030, Grand View Research). To its right a multi-line all-caps title reads "U.S. INFLUENCER MARKETING PLATFORM MARKET", with a faint "05" section number beside it and a small subtitle. The lower two-thirds is a stacked-bar chart: eleven bars (2020 to 2030) growing left to right, each split into four green tones from dark to pale. Below the axis, four rounded pill legend items name the segments (Campaign Management, Search & Discovery, Analytics & Reporting, Influencer Management), each with a colored dot.
Key takeaway
Pairing one oversized headline statistic with a clean stacked-bar growth chart so the market story lands before the reader parses the bars. The single green accent against the monochrome deck makes the one data slide pop without introducing a second color elsewhere.
Reuse notes
A reusable market-size or TAM slide. The big-stat-plus-chart split works for any growth narrative; the green-tone stack reads well on black but needs enough tonal separation between segments to stay legible. Keep the chart to one accent hue to match the deck's restraint.
From this deck: Market size growth chart
View deck








More like this







Keep what you find
A free account saves references to boards and can send you a weekly email of picks based on what you save.
To see every result, go Pro.