Preview image. Unlock full-res
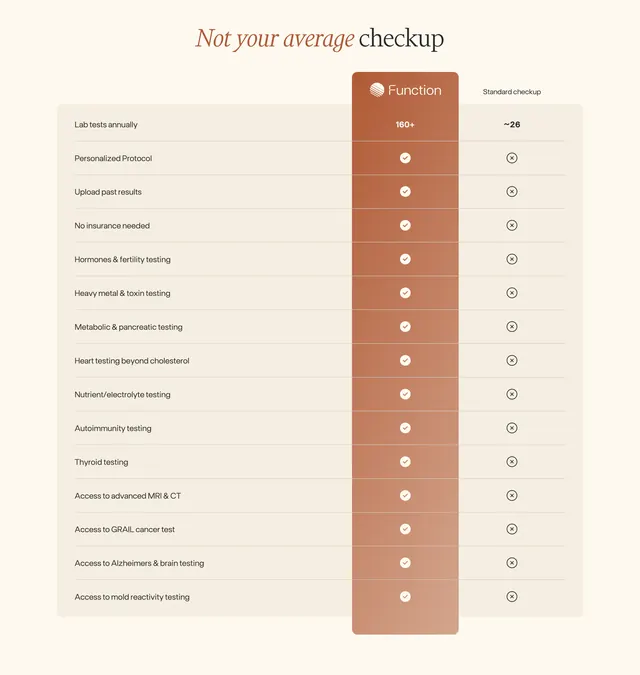
Three-column comparison table contrasting Function's 160+ lab tests and full feature set against a standard checkup with checkmarks and X marks.
Summary
"Not your average checkup" comparison matrix pits Function against a standard checkup across fifteen rows, opening with 160+ versus roughly 26 annual lab tests.
Visual description
Cream page with centered serif title where "Not your average" reads rust-brown and "checkup" reads charcoal. Below, a beige comparison table uses thin horizontal rules between rows. Left column lists feature labels in dark sans-serif. Center column is a tall rounded rust-to-brown gradient card extending above and below the table, topped with the Function logo and wordmark in white; cells show bold white "160+" for lab tests then white checkmark circles on every subsequent row. Right column labeled "Standard checkup" shows "~26" for lab tests and dark X circles for all other features. Feature rows cover personalized protocol, past results upload, no insurance, hormones, toxins, metabolic, heart, nutrients, autoimmunity, thyroid, MRI and CT access, GRAIL cancer test, Alzheimer's testing, and mold reactivity.
Key takeaway
The gradient brand column acts as a visual anchor so readers always know which side is "you." Leading with a numeric lab-test gap before a wall of checkmarks makes the advantage concrete before the detail rows.
Reuse notes
Works for any service stacking premium breadth against a commodity alternative. Long feature lists need short, scannable labels. Ensure X marks have text equivalents for accessibility.
More comparison sections
See all



More like this





Keep what you find
A free account saves references to boards and can send you a weekly email of picks based on what you save.
To see every result, go Pro.