Preview image. Unlock full-res
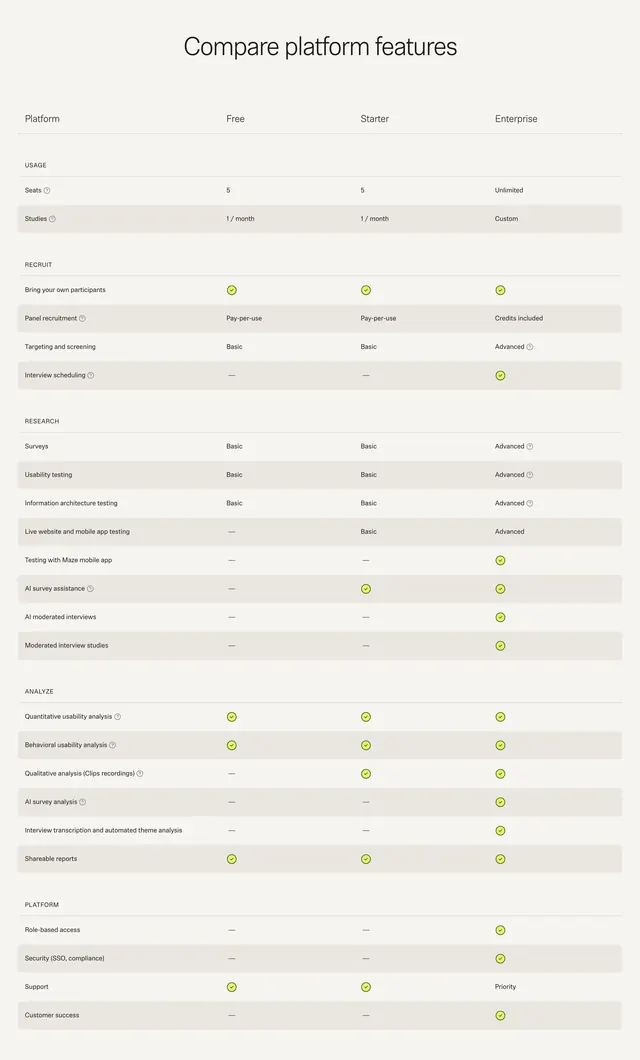
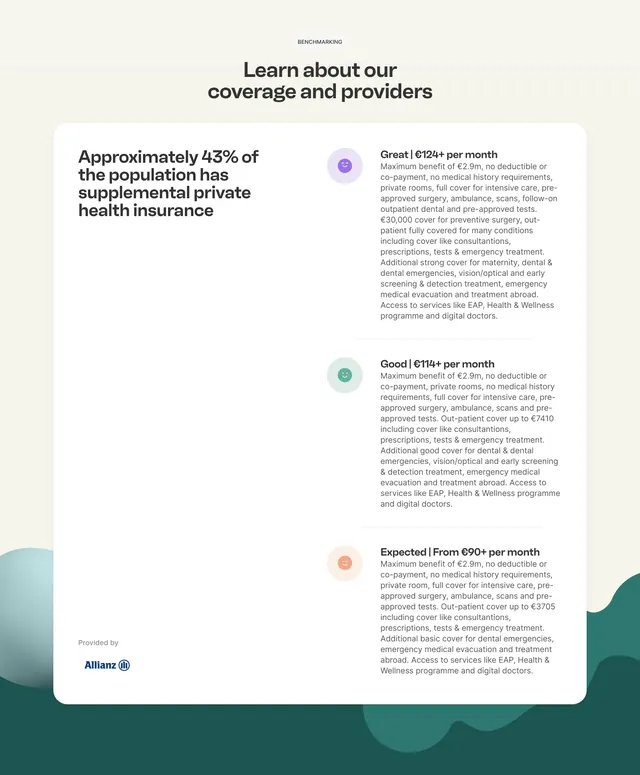
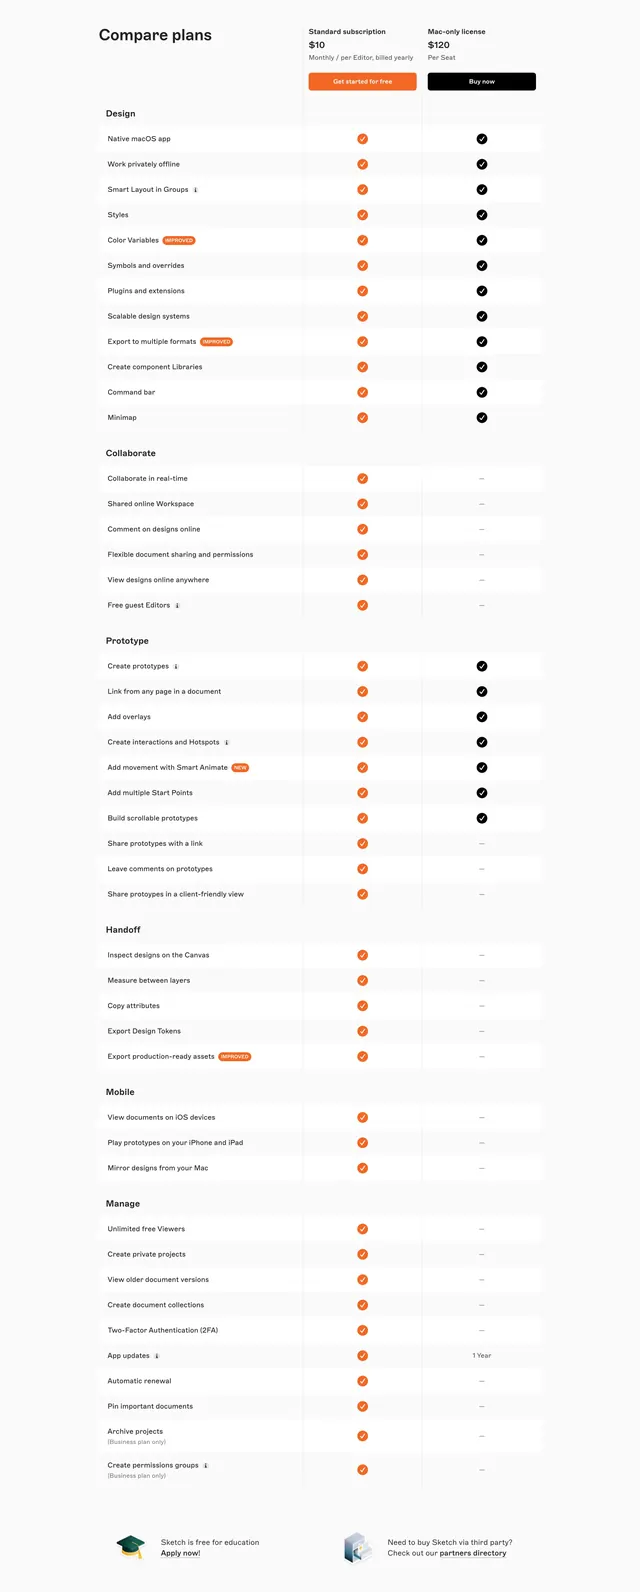
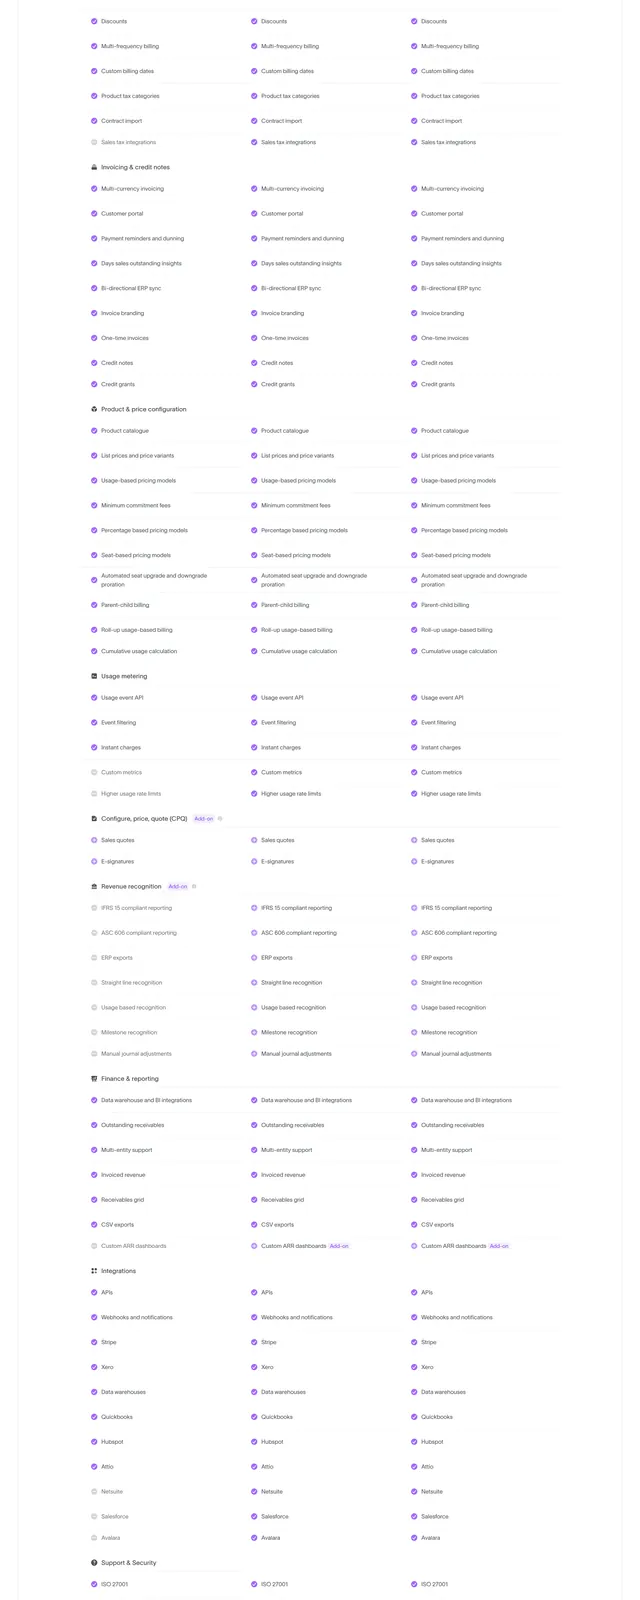
Beige comparison matrix of Free, Starter, and Enterprise tiers across usage, recruit, research, analyze, and platform sections.
Summary
Compare platform features table groups rows into Usage, Recruit, Research, Analyze, and Platform with green checks, dashes, and tier labels.
Visual description
Warm beige background with centered title Compare platform features. Four columns label Platform feature names, Free, Starter, and Enterprise. Small caps section headers divide rows. Alternating row fills improve scanability. Cells use green circular checkmarks, horizontal dashes, or text values like 5 seats, Unlimited, Basic versus Advanced, Pay-per-use panel, and Priority support. Info icons sit beside select feature names. Research rows span surveys, usability testing, AI moderated interviews, and mobile app testing with escalating capability labels by tier.
Key takeaway
Sectioned comparison tables keep dense SaaS matrices scannable. Green check circles on neutral beige feel clearer than colored column fills.
Reuse notes
Standard for pricing pages with many features. Requires disciplined grouping; more than five sections will feel endless on mobile.
More comparison sections
See all
More like this
Keep what you find
A free account saves references to boards and can send you a weekly email of picks based on what you save.
To see every result, go Pro.