Preview image. Unlock full-res
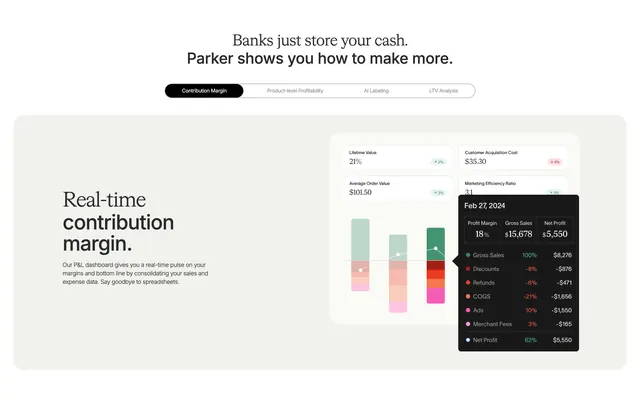
Light feature section with a centered tab bar above a split layout pairing a headline with a financial analytics dashboard.
Summary
A light feature section that uses a centered pill tab bar to switch between financial views, shown over a split layout with copy left and a contribution-margin dashboard right. The defining element is the tabbed navigation steering a detailed P&L product visual.
Visual description
Off-white background. A serif-led two-line statement headline ("Banks just store your cash. Parker shows you how to make more.") sits centered up top, followed by a rounded tab bar with four options (Contribution Margin active in black, plus Product-level Profitability, AI Labeling, LTV Analysis). Below, a wide beige rounded panel holds the feature: left side carries a serif "Real-time contribution margin." heading and grey paragraph; right side shows metric cards (Lifetime Value, CAC, AOV, Marketing Efficiency Ratio) above a green-toned bar chart, with a dark overlaid P&L card breaking down gross sales, discounts, refunds, COGS, ads, and net profit in red and green.
Key takeaway
Anchoring a feature block with a centered tab bar so one panel can demonstrate several analytics views. The dark P&L card overlapping light metric cards and a soft bar chart creates depth and signals real financial data without a raw screenshot.
Reuse notes
Best for fintech, analytics, or ecommerce-finance products with multiple data views worth toggling. Requires a polished dashboard mockup with believable numbers. The serif headline plus muted palette reads premium and trustworthy; keep the chart colors restrained so the data stays legible.
More features sections
See all




More like this






Keep what you find
A free account saves references to boards and can send you a weekly email of picks based on what you save.
To see every result, go Pro.