Preview image. Unlock full-res
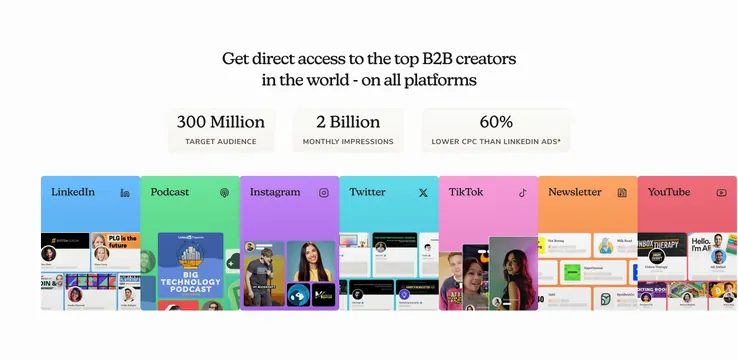
White stats band with three large metric cards and a row of seven color-coded platform columns showing creator reach across channels.
Summary
A proof section pairing three headline statistics with a rainbow row of platform-specific creator preview columns.
Visual description
White background opens with a centered black serif headline about direct access to top B2B creators across platforms. Three equal white cards with soft shadows sit in a row, each showing a large bold number (300 Million, 2 Billion, 60%) and a small gray all-caps label beneath (target audience, monthly impressions, lower CPC than LinkedIn ads with asterisk). Below, seven tall vertical columns span the width, each with a rounded top, distinct brand color, platform name, and icon header (LinkedIn, Podcast, Instagram, Twitter/X, TikTok, Newsletter, YouTube). Each column fills with miniature UI mockups: profile cards, podcast artwork, photo grids, tweet snippets, vertical video thumbs, newsletter blocks, and YouTube thumbnails including recognizable creator faces.
Key takeaway
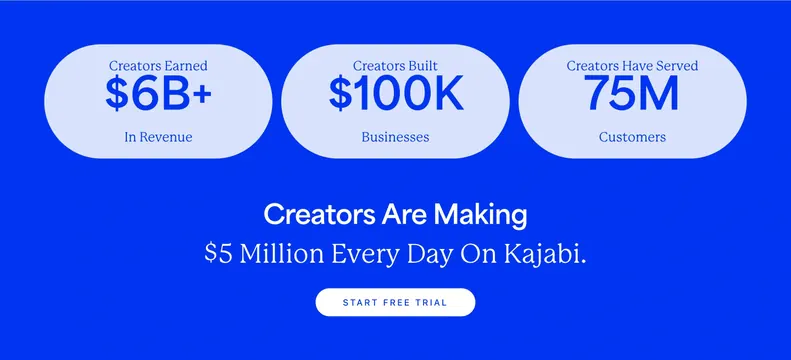
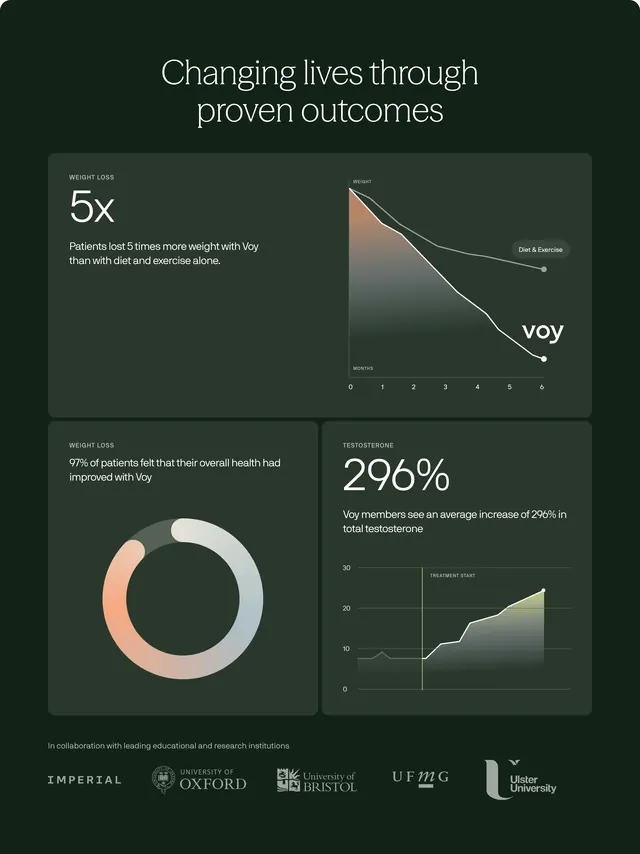
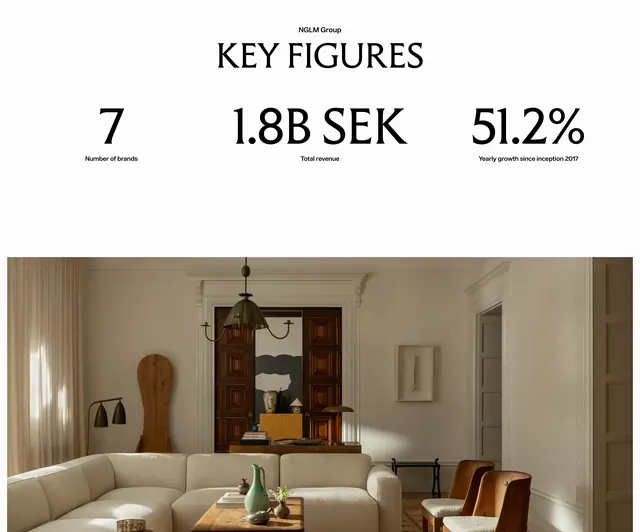
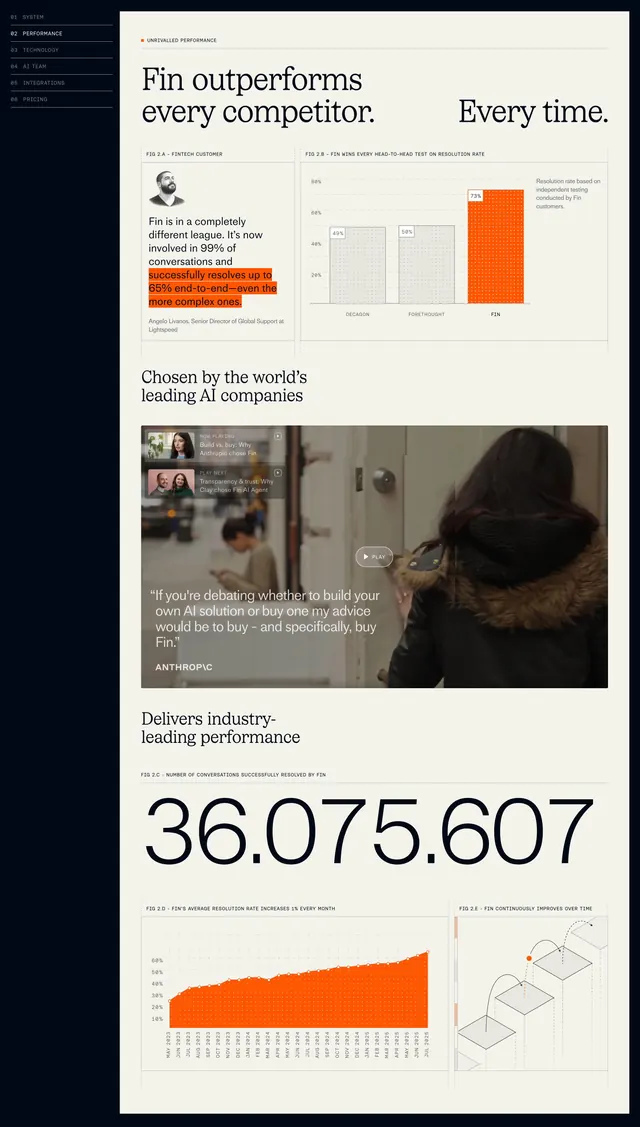
The stat row establishes scale in three numbers, then the platform columns make abstract reach tangible through channel-native micro-previews instead of a logo strip.
Reuse notes
Ideal for creator marketplaces or ad networks selling multi-platform inventory. Requires real or plausible creator thumbnails per column; empty columns will collapse the effect. Seven columns need a wide viewport or a horizontal scroll on mobile.