Preview image. Unlock full-res
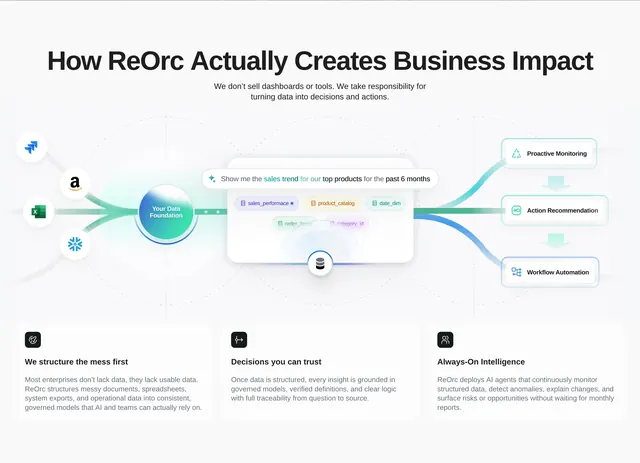
Light process section with a central NL query card flowing from data sources into three business outcome nodes, plus three supporting feature columns below.
Summary
Light process section with a central NL query card flowing from data sources into three business outcome nodes, plus three supporting feature columns below.
Visual description
Soft gray page with centered headline How ReOrc Actually Creates Business Impact and a responsibility-focused subline. Middle diagram on a faint grid: Fivetran, Amazon, Excel, and Snowflake logos feed a glowing Your Data Foundation orb, then a floating white card with a highlighted natural-language sales query and table tag chips (sales_performance, product_catalog, date_dim, order_items, category_id). Teal gradient paths branch right to three outcome boxes: Proactive Monitoring, Action Recommendation, and Workflow Automation, each with a small icon. Bottom row is three equal columns with black square icons and titles about structuring messy data, traceable decisions, and always-on AI agents.
Key takeaway
The NL query card with color-highlighted entities plus schema chips makes abstract data governance tangible. Source logos on the left and outcome boxes on the right frame the product as plumbing, not another dashboard.
Reuse notes
Ideal for data platform or AI agent vendors explaining end-to-end value. Diagram density needs generous vertical space; simplify logo count if partners are unknown.