Preview image. Unlock full-res
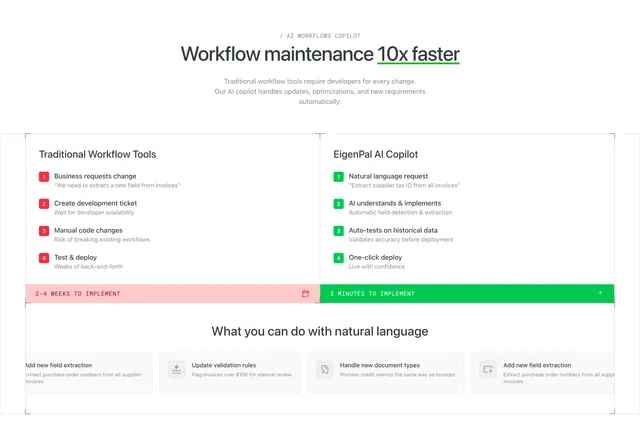
A two-column comparison that races a slow four-step "traditional" path (red) against a fast branded path (green), capped by colored time-to-implement footer bars.
Summary
A side-by-side process comparison that color-codes outcomes: a red, four-step "Traditional Workflow Tools" path versus a green, four-step "EigenPal AI Copilot" path, each sealed with a colored time-to-implement bar.
Visual description
White background. A small slash eyebrow ("/ AI workflows copilot") sits above a bold heading where "10x faster" is underlined in green. Two columns each list four numbered steps with a short caption: the left ("Traditional Workflow Tools") uses red number chips and ends in a red footer bar ("2-4 weeks to implement"); the right ("EigenPal AI Copilot") uses green number chips and ends in a green footer bar ("5 minutes to implement"). Below, a full-width row of four light cards shows natural-language examples (add a field, update validation rules, handle new document types).
Key takeaway
Encoding the verdict in color: red for the painful path, green for yours, reinforced by matching footer status bars that compress the whole argument into "weeks versus minutes." Numbered steps make both sides feel like the same process measured fairly.
Reuse notes
Effective when your advantage is speed or fewer steps. Keep both columns to the same step count so the comparison is honest. Red/green carries strong meaning, so reserve it for genuine better/worse, and add the icons or labels needed for colorblind readers since color alone should not carry the message.
More comparison sections
See all


More like this


Keep what you find
A free account saves references to boards and can send you a weekly email of picks based on what you save.
To see every result, go Pro.