Preview image. Unlock full-res
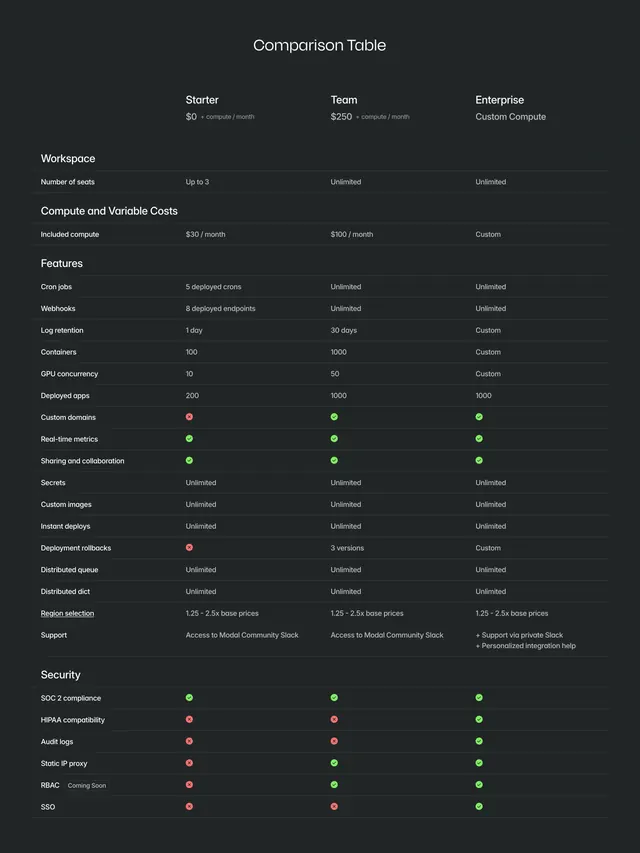
Dark feature comparison matrix across Starter, Team, and Enterprise with checkmarks, X icons, and grouped Workspace, Features, Security rows.
Summary
Comparison Table grid pitting three compute-plus-seat plans across workspace limits, feature caps, and security add-ons.
Visual description
Dark charcoal page with centered Comparison Table title and three plan columns showing Starter $0, Team $250, and Enterprise custom pricing. Rows group under Workspace, Compute, Features, and Security headers with thin dividers. Cells mix numeric limits, text values, green check circles, and red X circles. Notable rows cover seats, included compute credits, cron and webhook limits, GPU concurrency, custom domains, deployment rollbacks, Slack support, SOC 2, HIPAA, SSO, and RBAC with Coming Soon badge.
Key takeaway
Green check and red X circles make dense infra limits scannable without color everywhere. Section headers break a long matrix into mental chunks.
Reuse notes
Bottom-of-pricing-page plan differentiation for technical buyers. Needs disciplined row grouping; sparse plans look uneven in a wide table.
More comparison sections
See all

More like this
Keep what you find
A free account saves references to boards and can send you a weekly email of picks based on what you save.
To see every result, go Pro.