Preview image. Unlock full-res
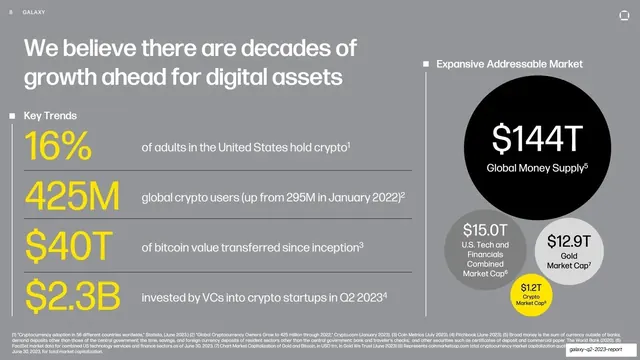
Headline with a left key-trends stat list and a right proportional-circle diagram comparing market sizes, on a mid-gray field.
Summary
A market-opportunity slide: an oversized headline, a left "Key Trends" column of yellow figures with descriptions, and a right proportional-circle diagram comparing total market sizes.
Visual description
Mid-gray field. Top-left, an oversized near-white headline reads "We believe there are decades of growth ahead for digital assets". The left half, under a "Key Trends" label with a small square marker, lists four yellow figures (16%, 425M, $40T, $2.3B) on hairline rules, each with a descriptive sentence in white and a footnote superscript. The right half, under "Expansive Addressable Market", is a proportional-circle (bubble) diagram: one very large black circle labeled "$144T Global Money Supply" dominates, with smaller gray and yellow circles ($15.0T, $12.9T, $1.2T) sized to their values clustered below. A dense legal footnote runs across the bottom.
Key takeaway
Putting a column of headline statistics next to a proportional-circle diagram so the same story is told twice: precise figures on the left, relative scale on the right. Sizing the circles to value (the giant money-supply circle dwarfing the small crypto-market circle) makes an addressable-market argument visually, not just numerically.
Reuse notes
A go-to layout for a TAM or opportunity-sizing slide. The proportional-circle diagram is reusable any time relative scale matters more than exact axes. Keep the largest circle genuinely dominant and label every bubble; the dense footnote is appropriate when citing many sources.
From this deck: Decades of growth ahead
View deck





More like this




Keep what you find
A free account saves references to boards and can send you a weekly email of picks based on what you save.
To see every result, go Pro.