
Preview image. Unlock full-res
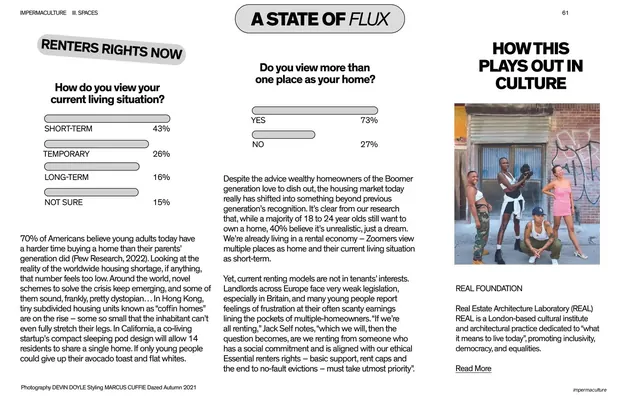
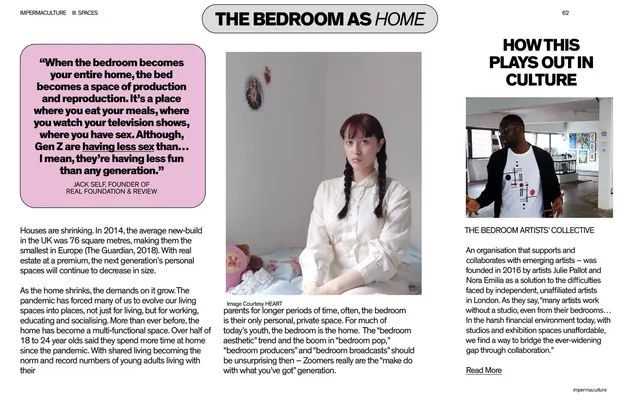
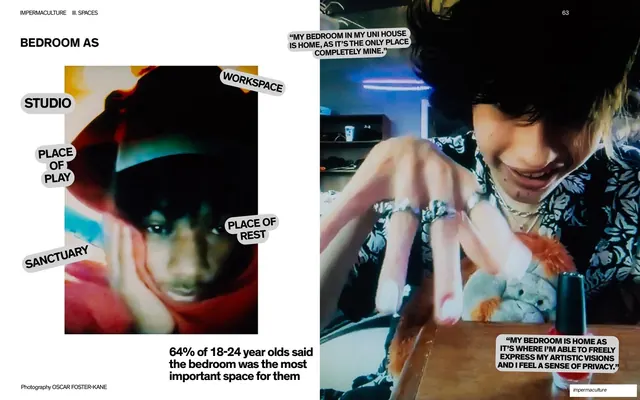
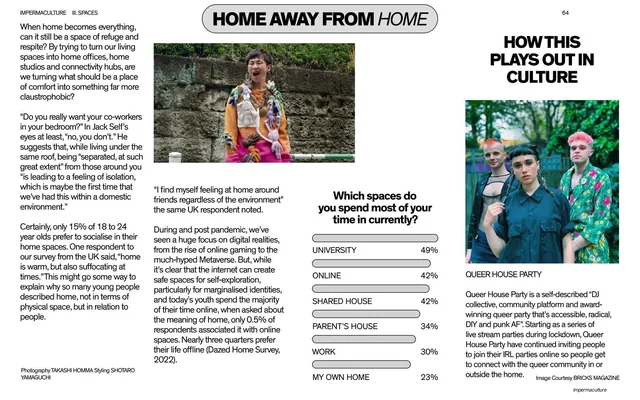
White data spread with three columns of horizontal grey bar charts ranking what home means and is used for, plus a single pink quote card, under a pink pill header.
Summary
A dense white data spread that "unpacks" home through three labelled columns of horizontal grey bars: top priorities for home, what home is used for, and home as a physical space, with one pink quote card breaking up the grid.
Visual description
White background, pink rounded pill badge at top reading "UNPACKING THE CONCEPT OF HOME" (with "HOME" italic). Three sections each with a bold all-caps subhead: "TOP PRIORITIES FOR HOME..." (left), "HOME IS USED FOR" (center, lower), and "HOME AS A PHYSICAL SPACE IS" (right). Under each, a stack of thin light-grey rounded horizontal bars whose lengths track descending percentages, each labelled below in small all-caps (Comfort 54%, Safety 44%, Self-Expression 28%, down to Online Spaces 0.2%; Relaxing 87% down to To Connect With Nature 12%; Family Home 50% down to Phone 0.2%). A pink rounded quote card sits center-top with a long participant quote attributed "HEART, 22, UK". The impermaculture badge is bottom-right.
Key takeaway
Running several ranked bar lists side by side as parallel columns so a lot of survey detail reads in one glance, with consistent thin rounded bars and tiny labels keeping it tidy. Dropping one pink quote card into the data grid adds a human voice without breaking the system.
Reuse notes
Built for results-heavy report pages with multiple ranked questions. The very long tails (sub-1% values) are honest but produce near-invisible bars; fine for completeness, less so for emphasis. Reuse the pink pill header and pink quote card to stay on-system across the chapter.
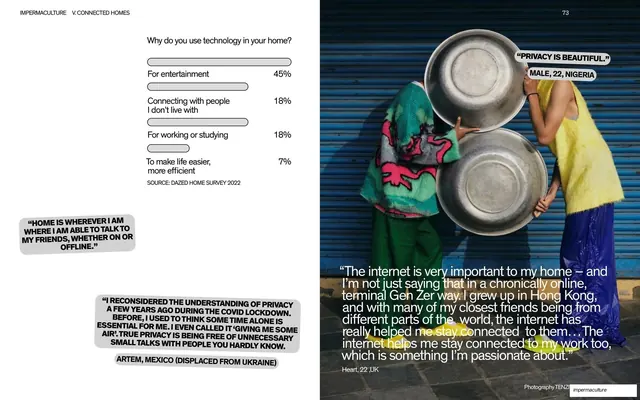
From this deck: Unpacking the concept of home survey bar charts
View deck


































More like this




Keep what you find
A free account saves references to boards and can send you a weekly email of picks based on what you save.
To see every result, go Pro.