
Preview image. Unlock full-res
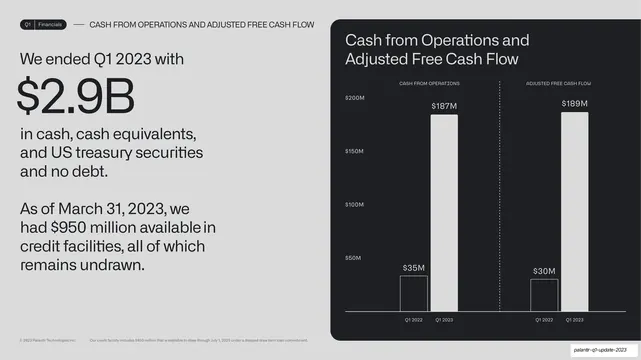
An oversized "$2.9B" cash statement on the left and a paired dark chart card on the right comparing cash from operations and adjusted free cash flow year over year.
Summary
A cash-strength slide: an oversized "$2.9B" on the left and a dark chart card on the right pairing Cash from Operations against Adjusted Free Cash Flow, each year over year.
Visual description
A light grey slide. Running header reads "Q1 | Financials" and "CASH FROM OPERATIONS AND ADJUSTED FREE CASH FLOW". The left column reads "We ended Q1 2023 with" above an enormous dark "$2.9B", then supporting copy about cash, treasury securities, no debt, and $950 million in undrawn credit facilities. The right is a rounded near-black card titled "Cash from Operations and Adjusted Free Cash Flow", split by a dotted vertical divider into two grouped sections, each with a small Q1 2022 bar and a tall Q1 2023 bar ($35M to $187M, and $30M to $189M). White bars, monospace section and axis labels. A small grey credit-facility footnote sits at the bottom.
Key takeaway
Splitting one chart card into two grouped comparisons with a dotted vertical divider, so two related cash metrics share a single framed chart. The oversized "$2.9B" headline keeps the deck's big-number rhythm going for the balance-sheet story.
Reuse notes
Use the in-card vertical divider whenever two metric groups belong together but should not be plotted on one shared axis. Good for cash, liquidity, or balance-sheet slides. Keep the dramatic small-to-tall bar jump readable by labeling both bars.
From this deck: $2.9B cash position big-number bar chart
View deck













More like this






Keep what you find
A free account saves references to boards and can send you a weekly email of picks based on what you save.
To see every result, go Pro.