Preview image. Unlock full-res
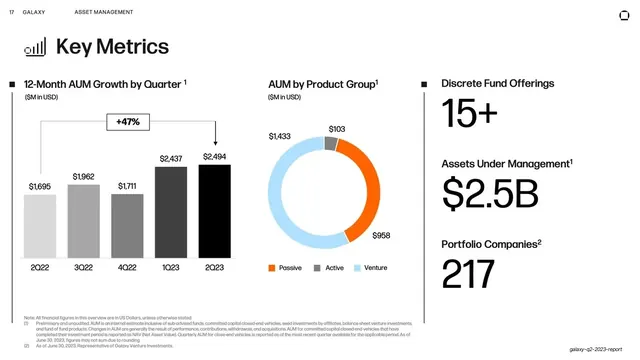
Light "Key Metrics" slide combining a quarterly AUM bar chart, a product-mix donut chart, and three oversized headline figures.
Summary
A "Key Metrics" slide for Asset Management: a quarterly AUM-growth bar chart on the left, a product-mix donut chart in the center, and three oversized headline figures on the right.
Visual description
White field with the section header and a small bar-chart icon before the "Key Metrics" title. The layout is three panels. Left: "12-Month AUM Growth by Quarter", a column chart of five bars (2Q22 to 2Q23) rising from light gray to black, the latest two emphasized, with a "+47%" callout in a small bordered tag over a bracket. Center: "AUM by Product Group", a donut chart split into orange (Passive), gray (Active) and light-blue (Venture) segments with dollar labels and a small legend. Right: under "Discrete Fund Offerings", "Assets Under Management" and "Portfolio Companies", three oversized near-black figures (15+, $2.5B, 217). A multi-line legal footnote sits along the bottom.
Key takeaway
Putting three views of one division's performance side by side: a time-series bar chart for trajectory, a donut for mix, and oversized figures for headline totals. The "+47%" tag bracketed across the first and last bars draws the growth story directly on the chart.
Reuse notes
A reusable financial-results slide for AUM, revenue, or any metric needing trend, composition and totals together. The bracketed growth-callout over a bar chart is a clean way to annotate change. Use a graduated gray-to-black bar treatment and one or two color segments in the donut to stay on the deck's restrained palette.
From this deck: Asset Management key metrics
View deck








More like this




Keep what you find
A free account saves references to boards and can send you a weekly email of picks based on what you save.
To see every result, go Pro.