Preview image. Unlock full-res
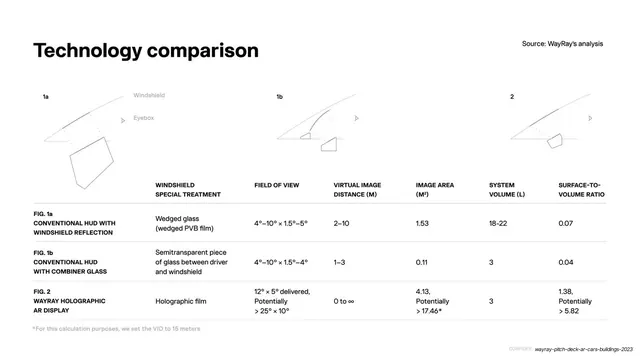
White slide with a black headline and a thin-rule comparison table of three HUD technologies across six spec columns, each row paired with a small line schematic.
Summary
A data-dense comparison: three HUD technologies scored across six spec columns in a hairline-ruled table, each row anchored by a small optical line schematic.
Visual description
White background, black type. Bold black headline "Technology comparison" top-left; a small grey "Source: WayRay's analysis" sits top-right. Across the top sit three thin line schematics of windshield-and-eyebox optical paths (labeled 1a, 1b, 2), with one path drawn in red. Below runs a table with hairline row rules: a left label column (Fig. 1a Conventional HUD with windshield reflection; Fig. 1b Conventional HUD with combiner glass; Fig. 2 WayRay Holographic AR Display) and six spec columns (Windshield Special Treatment, Field of View, Virtual Image Distance, Image Area, System Volume, Surface-to-Volume Ratio). The WayRay row shows the strongest numbers ("12 x 5 delivered, Potentially > 25 x 10", "0 to infinity", "4.13, Potentially > 17.46"). A small grey footnote sits at the bottom-left. A faint "CONFIDENTIAL" marker sits bottom-right.
Key takeaway
Pairing each table row with its own tiny technical schematic so a dense spec comparison stays visual, not just numeric. The understated hairline rules and grey source credit signal rigor and let the favorable WayRay row speak for itself without highlighting.
Reuse notes
Strong reference for an honest, credible comparison or competition slide where you want the numbers to win the argument. Works when you have real, defensible specs; the restraint (no colored "us" column, just clean data) reads as confident. Keep rules hairline and type small but legible to hold the data-dense feel.
From this deck: Technology comparison table
View deck







More like this




Keep what you find
A free account saves references to boards and can send you a weekly email of picks based on what you save.
To see every result, go Pro.