Preview image. Unlock full-res
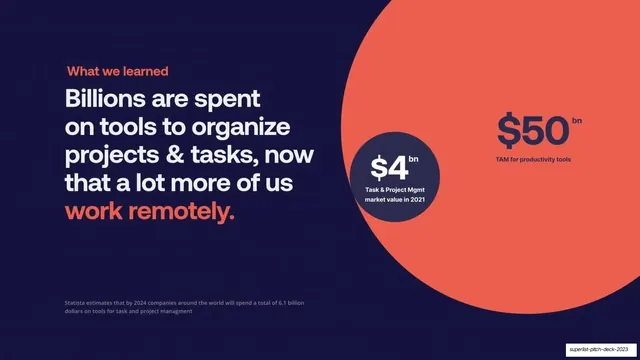
Dark market-size slide pairing a two-tone headline about remote-work spend with nested proportional circles showing a $4bn segment inside a $50bn TAM.
Summary
A market-sizing slide: a two-tone headline about billions spent on tools as more people work remotely, visualized with a small $4bn circle nested inside a large coral $50bn TAM circle.
Visual description
Deep navy field. Left half carries the coral "What we learned" eyebrow over a tall flush-left headline: "Billions are spent on tools to organize projects & tasks, now that a lot more of us" in white, with "work remotely." in coral. A small gray footnote sits low-left citing a Statista estimate. The right half is a proportional-circle chart: a large coral circle bleeding off the right edge labeled "$50bn / TAM for productivity tools" in navy, with a smaller dark navy circle overlapping its left side labeled "$4bn / Task & Project Mgmt market value in 2021" in white. The size contrast carries the headroom argument.
Key takeaway
Proportional nested circles to show a served segment inside a much larger TAM at a glance, with the big number bleeding off-canvas to feel even larger. The dollar figures sit inside the circles, so the visual and the data are one object.
Reuse notes
A reliable market-size pattern for any pitch. Keep the circle areas roughly to scale so the comparison is honest. The off-edge bleed adds drama but make sure the key label stays fully on-slide. Footnote the source as done here.
From this deck: Market size proportional circles
View deck






More like this




Keep what you find
A free account saves references to boards and can send you a weekly email of picks based on what you save.
To see every result, go Pro.