Preview image. Unlock full-res
A 19-slide Block research report that pairs stark black-and-white text slides with dark data panels, unified by an iridescent cyan-pink-violet gradient and yellow pill chart titles.
Summary
A 19-slide research report from Block, Inc. on global bitcoin knowledge and perceptions. Its whole identity rests on one move: a single iridescent cyan-pink-violet gradient (lifted from Block's 3D logo) threaded through black covers, white data slides, and dark chart panels, so a dense statistics deck reads as one coherent, branded object.
Visual description
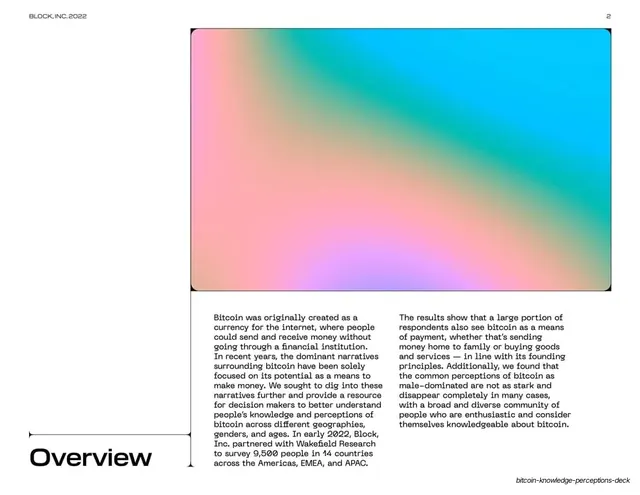
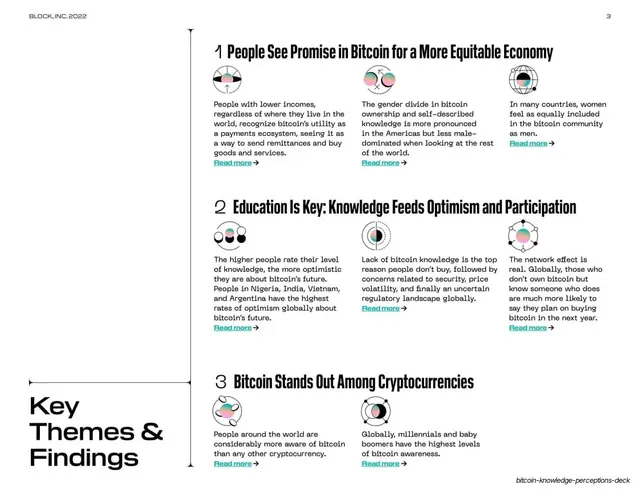
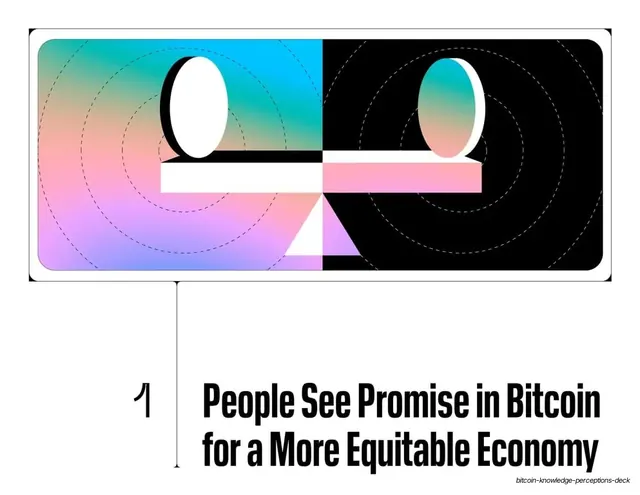
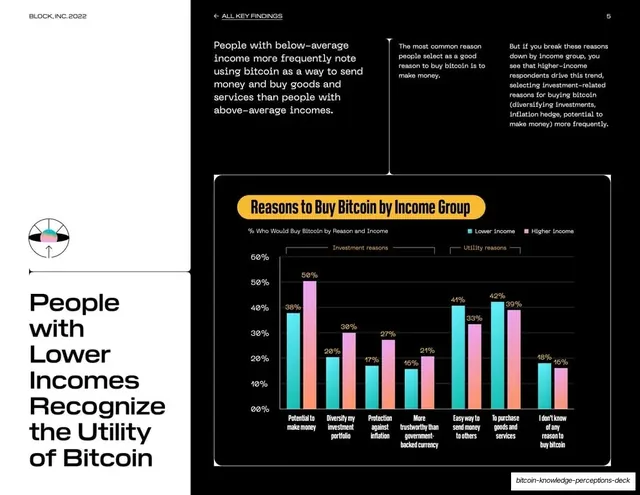
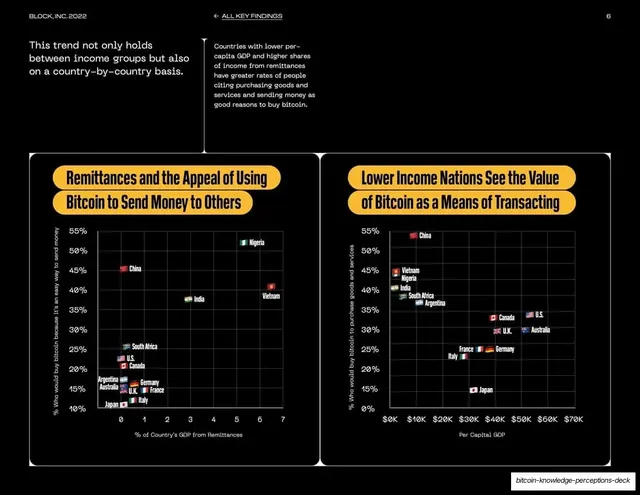
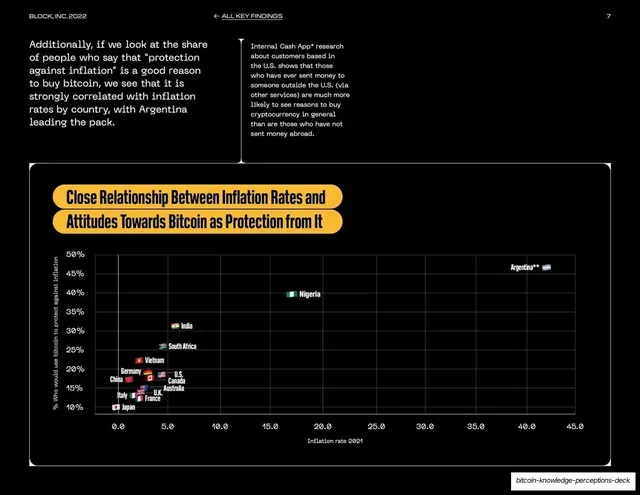
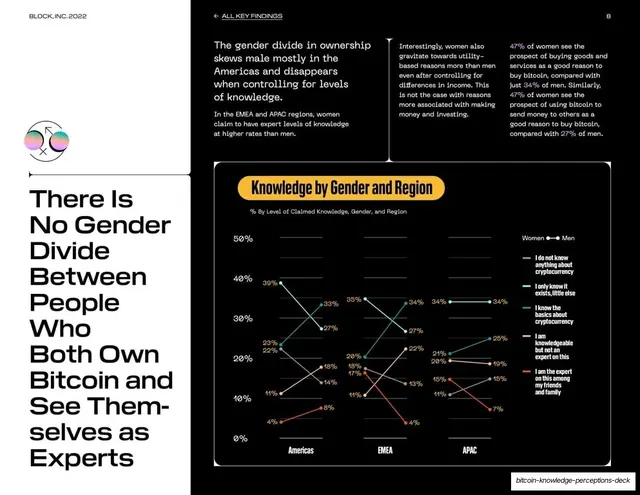
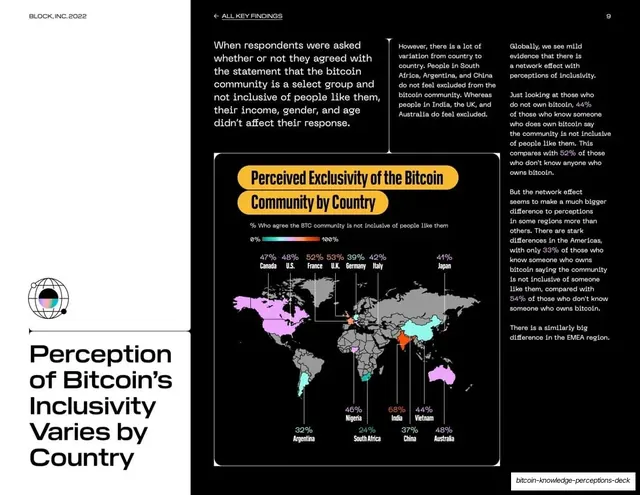
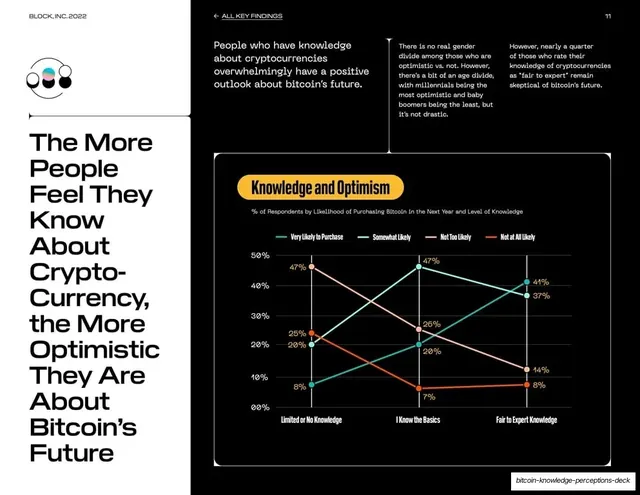
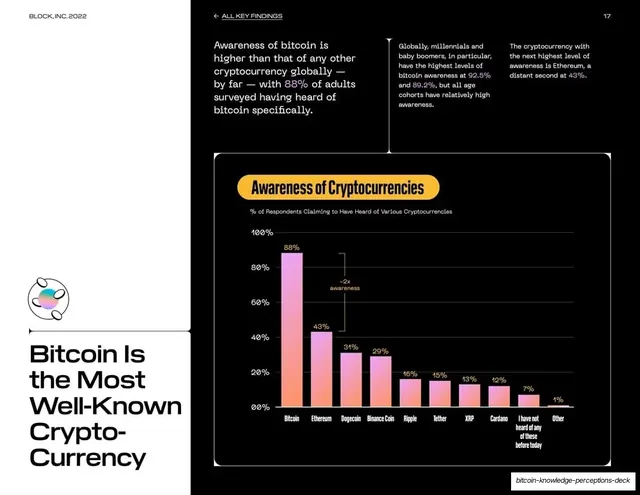
Slides are roughly 4:3. The deck runs on a two-mode system. Content slides are white with a wide black panel down the right side: a small holographic circular glyph and an oversized black headline (geometric grotesque, mixed-case, broken across many short lines) sit in the bottom-left rail, while two or three columns of small mono-flavored body copy run across the top of the black panel, and a large dark rounded-corner data panel fills the lower right. Inside each data panel the chart title sits in a rounded yellow (#F4B73F) pill in heavy black type, with a small caption beneath, and the charts themselves (grouped bars, line plots, scatter plots with country flags, stacked bars, proportional circles, a world map) are colored in the house teal (#3DD6C0), pink (#F58CB0), and violet (#C39BF5) on near-black. Section-divider slides flip to full-bleed black: a white rounded-rectangle frame holds an abstract iridescent illustration (a balance scale, a telescope/cylinders, scattered ovals) over dashed concentric guide lines, with a large outline numeral and a heavy condensed all-caps title below. The cover is black with the gradient logo cube top-left and a huge white "Bitcoin: Knowledge and Perceptions" headline plus a pink-gradient subtitle; the closing slide centers the 3D logo cube over "BLOCK". A persistent running header ("BLOCK, INC. 2022" left, "<- ALL KEY FINDINGS" center on interior slides, page number right) and thin bracket rules tie every page together.
Key takeaway
Deriving an entire deck palette from a single brand asset (the holographic logo) and then applying it consistently to charts, illustrations, and accents so even hardcore data slides stay on-brand. The yellow pill chart title is a small, repeatable device that labels every chart identically and pops against the dark panels. And the left-rail oversized headline broken into many short lines turns a plain stat slide into a strong typographic page.
Reuse notes
A strong template for any data-heavy research report, market study, or annual report that needs to feel designed rather than corporate-default. The white-slide-with-dark-data-panel layout is directly reusable for survey or analytics decks, and the black illustrated section dividers give a long report clear chapter breaks. Needs real charts with real numbers to fill the data panels, and the gradient only works if you have one strong source asset to derive it from. Note the cover reads "2022" while the gallery lists it as a 2023 publication.
From this deck: Block Bitcoin Knowledge and Perceptions Report
View deck
More like this





Keep what you find
A free account saves references to boards and can send you a weekly email of picks based on what you save.
To see every result, go Pro.