Preview image. Unlock full-res
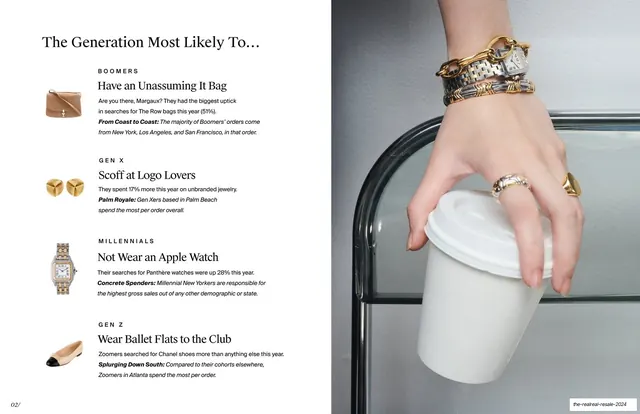
Generational breakdown listing Boomer, Gen X, Millennial, and Gen Z behaviors with small product cutouts at left, beside a photo of a wrist stacked with watches and rings.
Summary
A generational breakdown: four cohorts (Boomers, Gen X, Millennials, Gen Z), each with a witty headline, a stat, and a small product cutout, set beside a photo of a stacked wrist.
Visual description
A split layout. The left two-thirds, on off-white, opens with a large serif headline "The Generation Most Likely To..." over four stacked rows. Each row pairs a small silhouetted product cutout (a tan bag, gold studs, a two-tone watch, a black-and-white ballet flat) with a tiny all-caps cohort label (BOOMERS, GEN X, MILLENNIALS, GEN Z), a serif sub-headline ("Have an Unassuming It Bag", "Wear Ballet Flats to the Club"), and two lines of small sans-serif copy with bold and italic emphasis. The right third is a full-height photo of a hand holding a coffee cup, the wrist stacked with gold and silver bracelets and rings. A small "02/" page index sits bottom-left.
Key takeaway
The repeated row template (product cutout, all-caps label, serif sub-headline, short stat copy) that turns four audience segments into a tidy, scannable comparison. The small silhouetted cutouts add product texture without breaking the clean grid. Witty serif sub-heads keep dry demographic data engaging.
Reuse notes
Reusable for persona, segment, or cohort comparison slides in any report or strategy deck. The cutout-plus-label-plus-stat row scales to three to five segments cleanly. Needs consistent, evenly-silhouetted cutout images to look intentional.
From this deck: The Generation Most Likely To generational breakdown
View deck


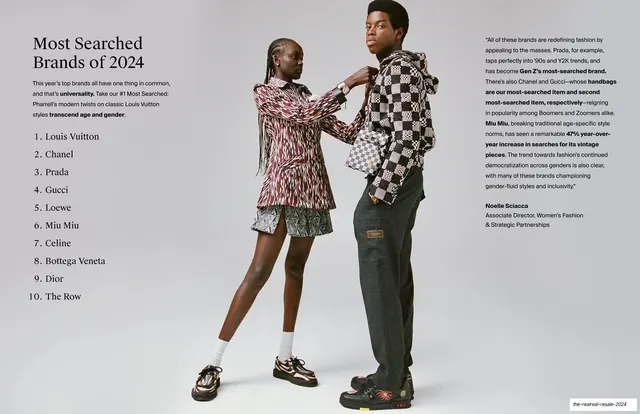
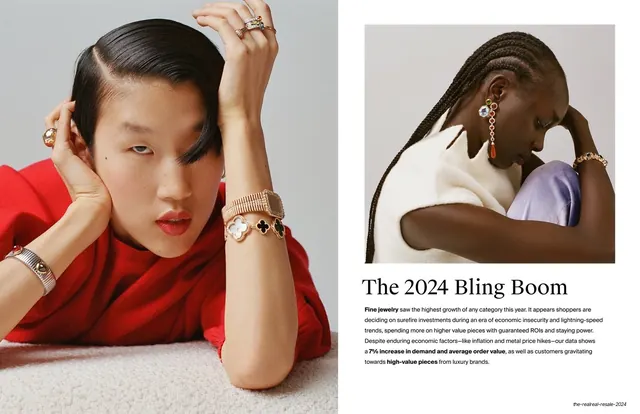
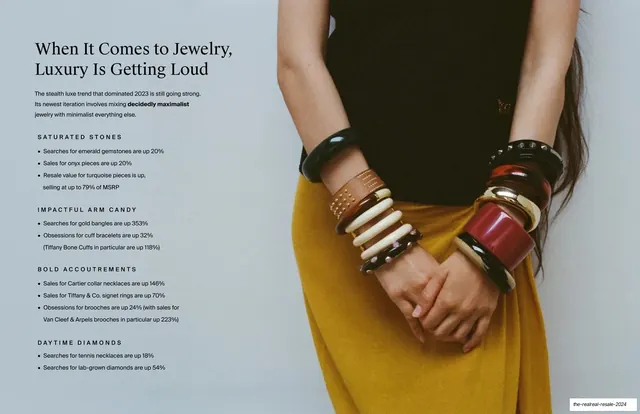








More like this







Keep what you find
A free account saves references to boards and can send you a weekly email of picks based on what you save.
To see every result, go Pro.