Preview image. Unlock full-res
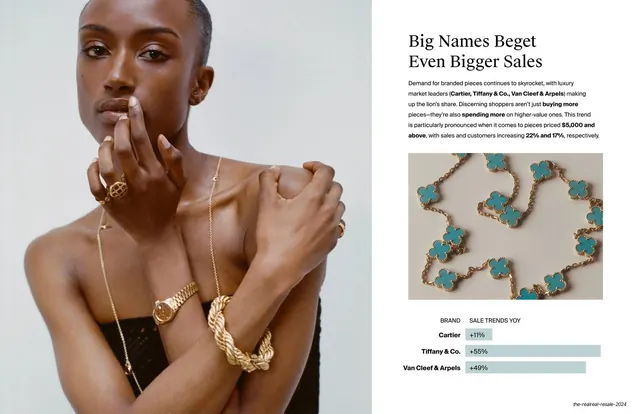
Branded-jewelry data slide with a full-height portrait at left and a stacked headline, body copy, product photo, and mint YoY bar chart at right.
Summary
The branded-jewelry data slide: a full-height portrait at left, and at right a serif headline, body copy, a product photo of a turquoise clover necklace, and a small mint-green YoY bar chart for Cartier, Tiffany & Co., and Van Cleef & Arpels.
Visual description
A split spread. The left half is a full-height photo of a model in a black top, arms crossed, wearing a gold rope bracelet, watch, and long necklace. The right half stacks, on off-white: a two-line serif headline "Big Names Beget Even Bigger Sales", a paragraph of small sans-serif body copy with bolded stats, a rectangular product photo of a turquoise Van Cleef-style clover necklace, and a compact horizontal bar chart. The chart lists three brands (Cartier +11%, Tiffany & Co. +55%, Van Cleef & Arpels +49%) with bold brand labels and soft mint-green (#C7DAD2) bars under a tiny "BRAND / SALE TRENDS YOY" header.
Key takeaway
Stacking a headline, supporting copy, a product still, and a small bar chart in one column so a single slide carries the claim, the proof, and the picture. The soft mint bar treatment keeps the data feeling editorial rather than corporate, and bar length plus a printed percentage make each figure instantly readable.
Reuse notes
A reusable template for a data point that needs context: narrative on top, evidence (chart) below, product shot between. The mint horizontal bar chart with bold left labels and inline percentages is the deck's signature data device and recurs on other slides. Keep bar counts low (three to five) for this stacked treatment.
From this deck: Big Names Beget Even Bigger Sales data slide
View deck


More like this



Keep what you find
A free account saves references to boards and can send you a weekly email of picks based on what you save.
To see every result, go Pro.