Preview image. Unlock full-res
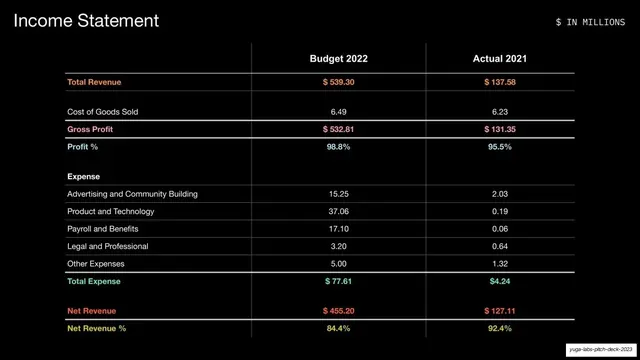
A two-column income statement (Budget 2022 vs Actual 2021) on black, with color-coded summary rows in a clean hairline-ruled table.
Summary
A financials table: an income statement comparing Budget 2022 and Actual 2021, with key summary rows color-coded for emphasis on a black ground.
Visual description
Black background. Top-left headline "Income Statement" in white sans-serif; a small monospace "$ IN MILLIONS" label sits top-right. A two-column table compares "Budget 2022" and "Actual 2021". Line items run down a left label column (Total Revenue, Cost of Goods Sold, Gross Profit, Profit %, then an Expense block with Advertising, Product and Technology, Payroll, Legal, Other, and Total Expense, then Net Revenue and Net Revenue %). Summary rows are tinted: Total Revenue in orange, Gross Profit in pink, Total Expense and Net Revenue in green and red. Thin white hairline rules separate the rows; values are right-aligned in each column.
Key takeaway
Color-tinting only the summary rows (revenue, gross profit, expense, net) so the eye lands on the totals while detail rows stay neutral white. Hairline rules and right-aligned figures keep a dense financial table calm and scannable on a dark background.
Reuse notes
A clean template for any financials, P&L, or budget-vs-actual slide. The accent-tinted summary rows match the deck's chart palette for consistency across data slides. Two columns is the comfortable maximum at this type size; more periods would need smaller type or a chart. Reusable wherever a real table beats a chart.
From this deck: Income statement table
View deck








More like this





Keep what you find
A free account saves references to boards and can send you a weekly email of picks based on what you save.
To see every result, go Pro.