Preview image. Unlock full-res
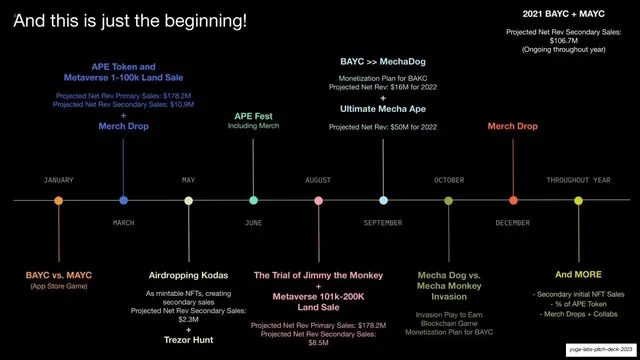
A horizontal month-by-month 2022 roadmap on black with color-coded milestone nodes alternating above and below the timeline.
Summary
A horizontal 2022 roadmap on black: a thin timeline with color-coded dots, each carrying a milestone and projected-revenue note alternating above and below the line.
Visual description
Black background. Top-left headline "And this is just the beginning!" in white sans-serif. A thin horizontal line runs across the middle of the slide marked with month labels (January through December, plus "Throughout Year"), each at a colored node. Milestones alternate above and below the line, each set in its node's accent color: orange "BAYC vs. MAYC (App Store Game)", blue "APE Token and Metaverse 1-100k Land Sale + Merch Drop", green "APE Fest", a "BAYC >> MechaDog + Ultimate Mecha Ape" cluster, an orange "Merch Drop", and others, most with small "Projected Net Rev" figures in white. A top-right block notes "2021 BAYC + MAYC" with a secondary-sales projection.
Key takeaway
Color-coding each milestone node and its label so a dense, text-heavy timeline still reads at a glance, with color doing the grouping work. Alternating entries above and below a single hairline keeps a full year of detail legible without crowding.
Reuse notes
A reusable pattern for any roadmap, go-to-market timeline, or launch calendar with many dated items. The color-per-node system matches the deck's chart palette, tying the data slides together. Best when each milestone is short; the projected-revenue notes show how to attach a metric to each beat. Can get busy fast, so cap the number of nodes.
From this deck: And this is just the beginning roadmap
View deck



More like this



Keep what you find
A free account saves references to boards and can send you a weekly email of picks based on what you save.
To see every result, go Pro.