
Preview image. Unlock full-res
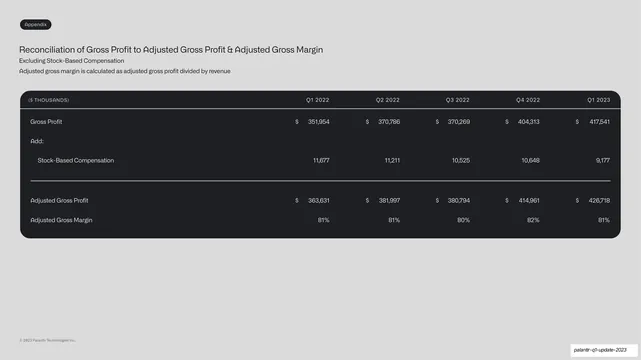
An appendix reconciliation table inside a dark rounded panel, bridging gross profit to adjusted gross profit and margin across five quarters.
Summary
A non-GAAP reconciliation: gross profit bridged to adjusted gross profit and adjusted gross margin across five quarters, in the standard dark table panel.
Visual description
A light grey slide with an "Appendix" tab and the title "Reconciliation of Gross Profit to Adjusted Gross Profit & Adjusted Gross Margin", plus two subhead lines ("Excluding Stock-Based Compensation" and the margin definition). A wide rounded near-black panel holds the table: monospace header ("$ THOUSANDS" and five quarter columns), then Gross Profit (351,954 ... 417,541), an "Add:" line with an indented Stock-Based Compensation row, a divider, then Adjusted Gross Profit (363,631 ... 426,718) and Adjusted Gross Margin (81% / 81% / 80% / 82% / 81%). Right-aligned dollar cells throughout.
Key takeaway
The same add/result reconciliation extended to five quarter columns, showing the full-year trend of a non-GAAP measure in one table. Keeping the identical panel and header style as the prior reconciliation means the reader already knows how to read it.
Reuse notes
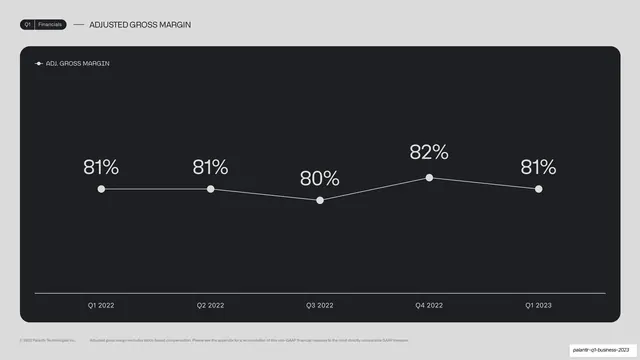
Use the five-column version when a full-year reconciliation trend is wanted rather than a single before/after. The consistent panel, indentation, and divider rules carry across all reconciliation slides. Pair the resulting margin row with the matching chart earlier in the deck.
From this deck: Adjusted gross profit reconciliation table
View deck












More like this



Keep what you find
A free account saves references to boards and can send you a weekly email of picks based on what you save.
To see every result, go Pro.