Preview image. Unlock full-res
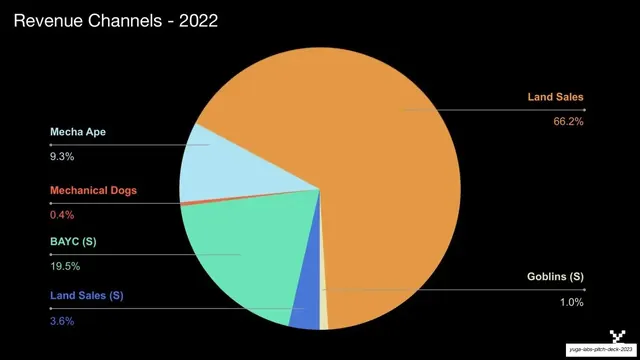
A 2022 revenue-channels pie chart on black with color-coded slices and leader-line labels, dominated by a 66.2% Land Sales segment.
Summary
A data slide: a single pie chart of 2022 revenue channels on black, color-coded by segment with leader-line labels, dominated by Land Sales at 66.2%.
Visual description
Black background. Top-left headline "Revenue Channels - 2022" in white sans-serif. A large pie chart sits center-right. Segments are color-coded and labeled via thin leader lines to the surrounding margin: a dominant orange "Land Sales 66.2%", a green "BAYC (S) 19.5%", a pale-blue "Mecha Ape 9.3%", a blue "Land Sales (S) 3.6%", a thin red "Mechanical Dogs 0.4%", and "Goblins (S) 1.0%". Each label shows the channel name in its segment color above a percentage.
Key takeaway
One large pie carrying the whole slide, with leader lines fanning labels out to the margins so even the tiny sub-1% slices stay readable. Segment colors reused from the deck's shared palette keep this consistent with the other data slides.
Reuse notes
A clean revenue-mix or breakdown slide. Pies work when one segment clearly dominates, as here; for evenly split data a bar chart reads better. The leader-line labels are the key move for small slices. Reusable for any single-metric composition breakdown on a dark deck.
From this deck: Revenue channels pie chart
View deck






More like this




Keep what you find
A free account saves references to boards and can send you a weekly email of picks based on what you save.
To see every result, go Pro.