Preview image. Unlock full-res
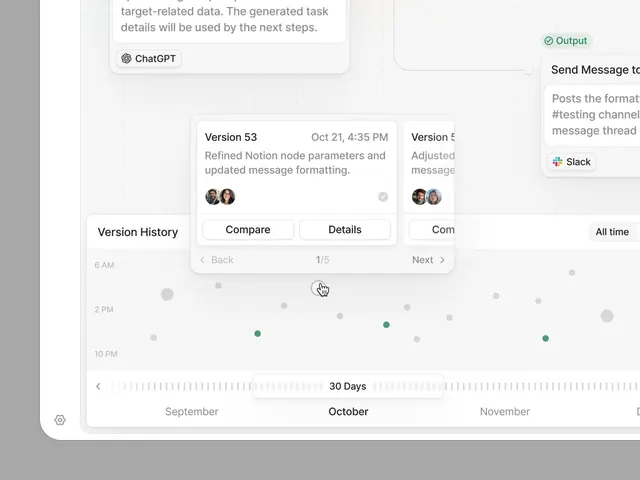
A SaaS version control interface showing a horizontal timeline of release versions with detail cards, avatars of contributors, and action buttons (Compare, Details) below a list of version entries.
Summary
A developer-facing version history UI centered on a horizontal timeline showing multiple releases (Version 53, etc.) with timestamps, contributor avatars, change descriptions, and action buttons for comparison and detail inspection.
Visual description
Minimal light-mode interface with left sidebar, main timeline area, and information panel on the right. A left-side panel shows "Version History" and time markers (6 AM, 2 PM, 10 PM). The center displays a horizontal timeline of dot markers representing version events scattered across months (September, October, November). Above the timeline sit stacked white cards showing version metadata: "Version 53" dated "Oct 21, 4:35 PM" with description "Refined Notion node parameters and updated message formatting," small circular avatars of two contributors at the bottom, and three action buttons (Compare, Details, and a partially visible third option). Pagination controls ("Back", "1/5", "Next") appear below. A right sidebar shows integrations like ChatGPT and Slack. All text uses sans-serif in dark gray and black on white, with muted horizontal dot indicators for timeline density.
Key takeaway
A clean horizontal timeline view that visualizes version history spatially, making it easy to scan when changes occurred. Using small circular avatars to signal collaboration without cluttering the interface. A button grouping pattern (Compare, Details) that provides quick access to related actions in a focused, minimal form.
Reuse notes
Perfect for SaaS products with version control, release notes, or collaboration features. The timeline approach works well for documentation sites and API-first platforms where version history is critical. The minimal color palette and data-dense layout suit technical audiences and reduce cognitive load. Pairs well with tables and structured data displays for developer tools.