Preview image. Unlock full-res
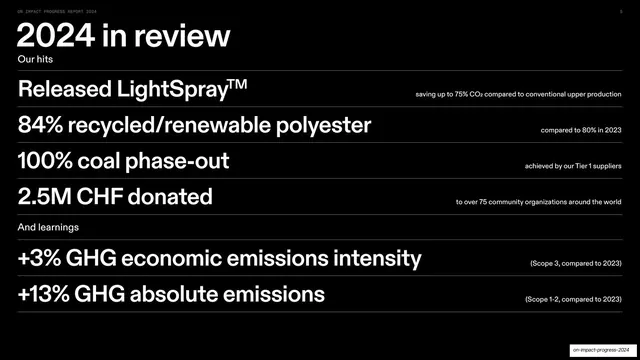
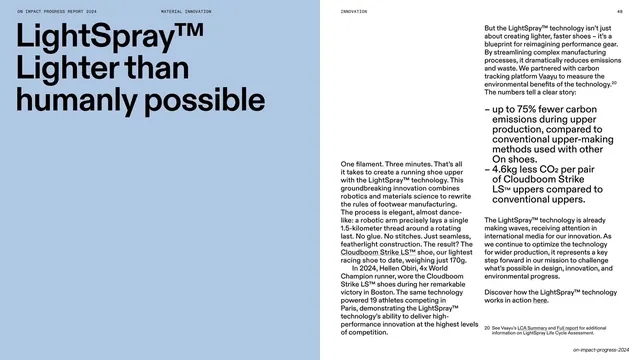
Dark stat-stack summary listing six oversized headline figures on hairline rules, each with a small right-aligned qualifier, grouped under "Our hits" and "And learnings".
Summary
The year-in-review summary: a black slide that stacks six oversized white headline figures, each on its own hairline-ruled row with a small right-aligned qualifier, split into "Our hits" and "And learnings".
Visual description
A true-black slide. Top-left, an oversized two-tone headline reads "2024 in review" (white over a smaller grey "Our hits"). Below, a list of full-width rows separated by thin white hairline rules: each row pairs an oversized white left-aligned statement ("Released LightSpray", "84% recycled/renewable polyester", "100% coal phase-out", "2.5M CHF donated") with a small grey right-aligned qualifier ("saving up to 75% CO2...", "compared to 80% in 2023"). A grey sub-label "And learnings" introduces two more rows in the same grammar ("+3% GHG economic emissions intensity", "+13% GHG absolute emissions"). The all-caps running header and page number "5" sit at the top.
Key takeaway
The hairline-ruled stat-stack: one oversized claim per row, with the nuance demoted to a tiny right-aligned qualifier, so the page scans as a list of big numbers but still carries the caveats. Splitting into "hits" and "learnings" with grey sub-labels is an honest, reusable way to show wins and misses on one screen.
Reuse notes
A strong executive-summary or highlights slide for any report that needs to surface several headline metrics at once. The pattern scales to any number of rows and reads equally well in dark or light. Keep qualifiers short; they are meant to be read second.
From this deck: 2024 in review, hits and learnings
View deck


































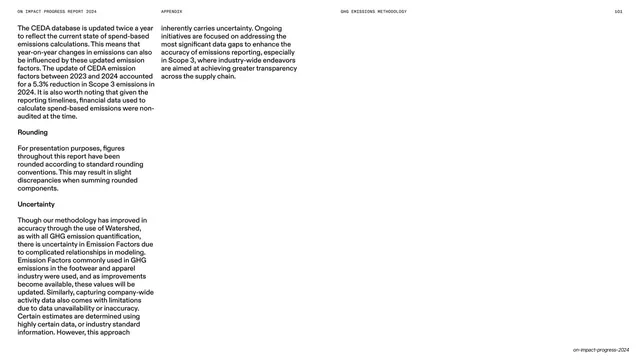
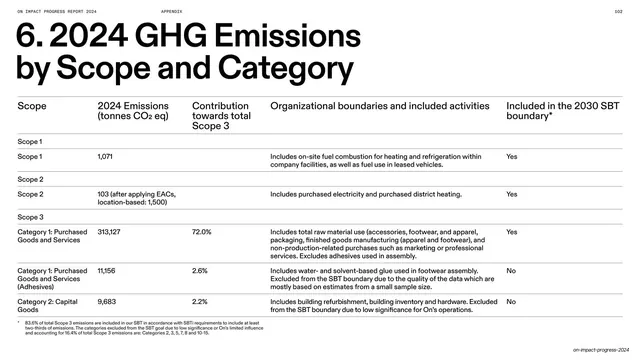
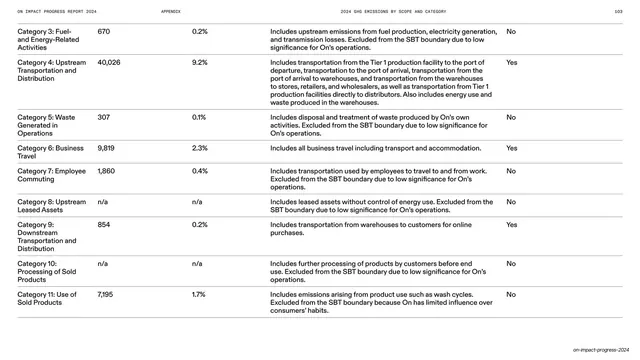
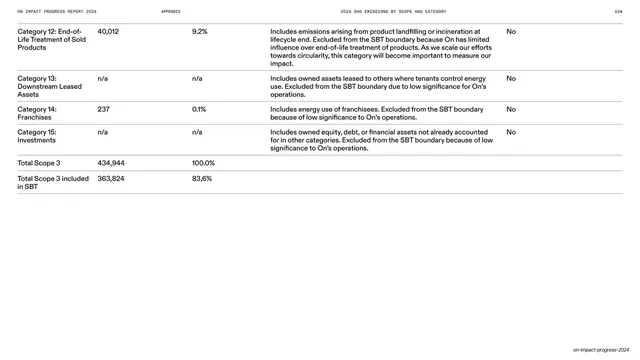



More like this






Keep what you find
A free account saves references to boards and can send you a weekly email of picks based on what you save.
To see every result, go Pro.