
Preview image. Unlock full-res
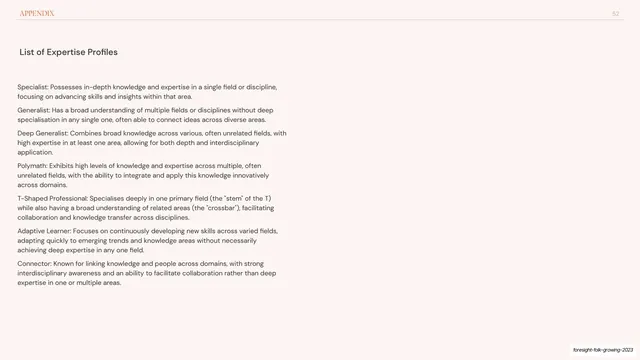
Split slide pairing a left column of bolded expertise-profile definitions with a right tan horizontal bar chart of how respondents self-identify.
Summary
A profiles slide: the left column defines eight self-identified expertise profiles (Specialist, Adaptive Learner, Generalist, Deep Generalist, Polymath, T-Shaped, Connector) as bold-lead definitions, and the right shows a tan horizontal bar chart of how often each was chosen.
Visual description
Cream background, hairline running header (chapter label left, "30" right). A two-line dark headline tops the slide. The left half is a stack of definitions, each profile name bolded then explained in a sentence or two of dark body text, reading like a glossary. The right half is a horizontal bar chart titled "Expertise profiles" in muted tan/blush, with right-aligned profile labels and percentage values at the bar ends; Deep Generalist (24%) and Polymath (22%) are the longest bars, Specialist (3%) the shortest. Grey question footnote below; deck-slug annotation bottom-right.
Key takeaway
Placing the definition list and its matching chart side by side, so a reader meets each profile's meaning and its prevalence on the same screen. Switching the bar color to tan here distinguishes "profiles" from the coral "competencies/skills" charts while keeping the same chart grammar.
Reuse notes
A strong pattern when categories need both explanation and quantification at once (segments, personas, archetypes). Keep the left-list order matched to the chart order so the eye can pair them. Reserve a distinct accent for this chart family so different question types stay visually separable across the deck.
From this deck: Expertise profiles definitions and bar chart
View deck









More like this




Keep what you find
A free account saves references to boards and can send you a weekly email of picks based on what you save.
To see every result, go Pro.