Preview image. Unlock full-res
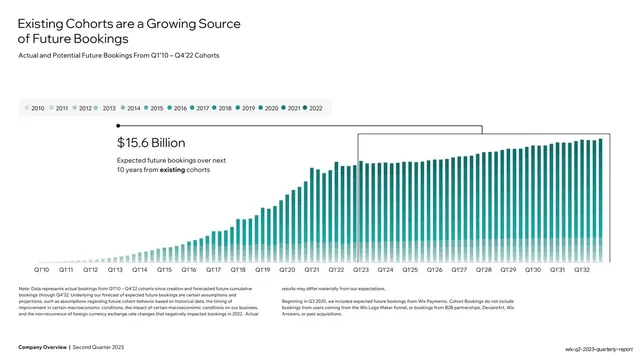
White slide with a long teal gradient bar chart of actual and forecast cohort bookings, a bracketed forecast region, and a $15.6 Billion callout.
Summary
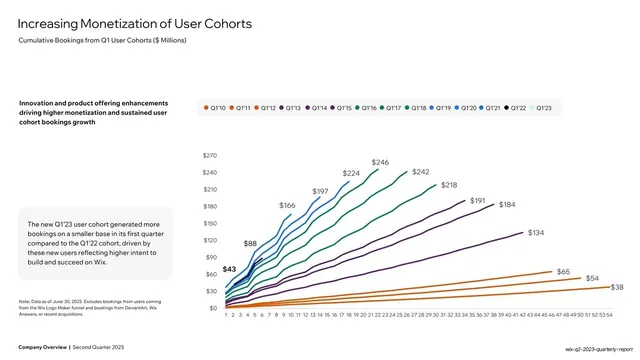
A long-range cohort chart: a dense row of teal gradient bars rising from Q1'10 to Q1'32, with the forecast years bracketed and a "$15.6 Billion" expected-future-bookings callout.
Visual description
White background. Two-line headline "Existing Cohorts are a Growing Source of Future Bookings" top-left, "Actual and Potential Future Bookings From Q1'10 - Q4'22 Cohorts" subtitle. A horizontal year-legend pill (2010-2022) runs across the top in a teal scale. The plot is a long sequence of slim vertical bars, each a teal gradient fading toward the base, rising steadily along a quarterly x-axis (Q1'10 to Q1'32). A thin black bracket frames the future-quarters region (roughly Q1'23 onward), with "$15.6 Billion / Expected future bookings over next 10 years from existing cohorts" called out beside it. Two-column methodology footnote below; bold footer.
Key takeaway
Using a single thin bracket to fence off the forecast portion of a long bar series, anchored by one oversized headline number, so a 22-year projection reads as "this much is already locked in" at a glance.
Reuse notes
For long-horizon forecasts or backlog/locked-revenue stories. The teal gradient bars and bracketed forecast region are a clean way to separate actuals from projection without changing chart type. The single big-number callout does the persuading; keep it bold and short.
From this deck: Existing Cohorts future bookings bar chart
View deck







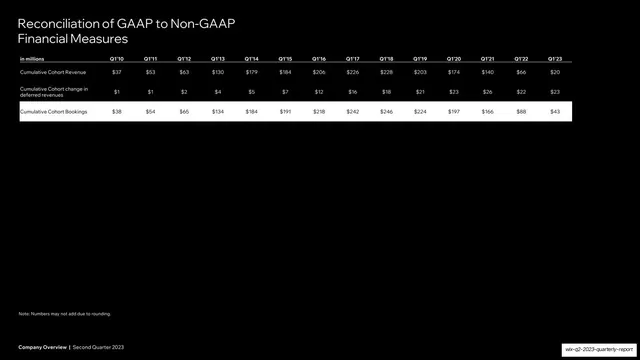

More like this
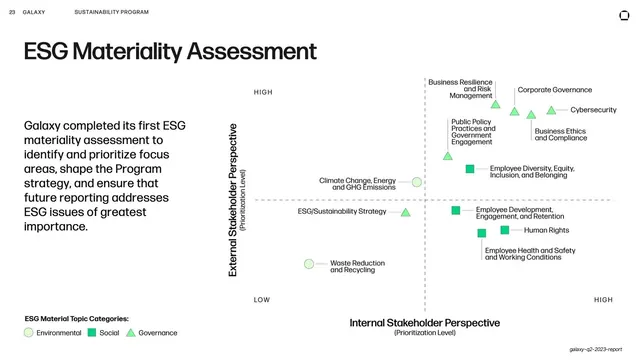

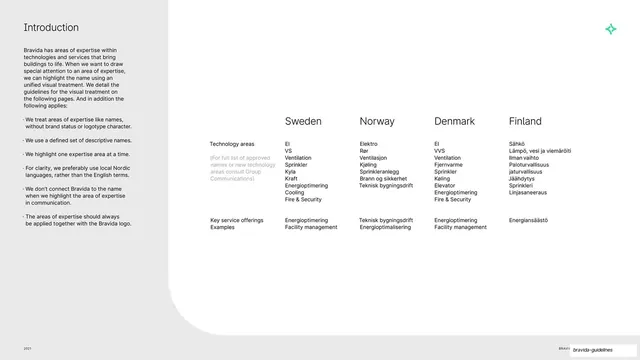


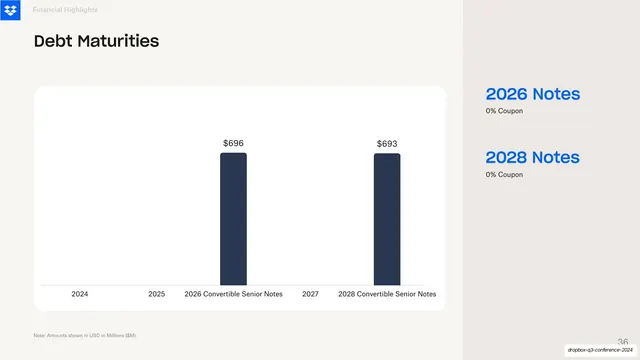

Keep what you find
A free account saves references to boards and can send you a weekly email of picks based on what you save.
To see every result, go Pro.