Preview image. Unlock full-res
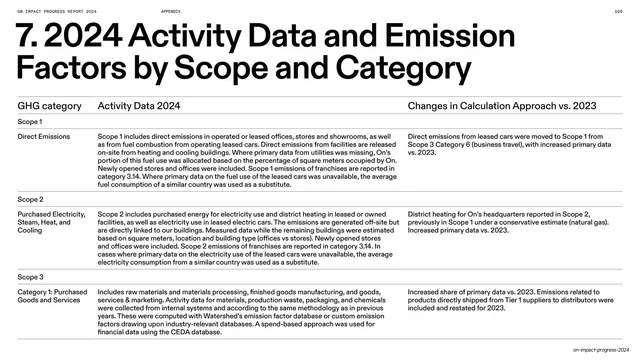
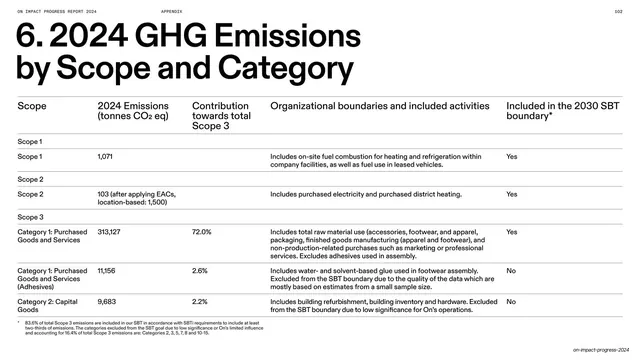
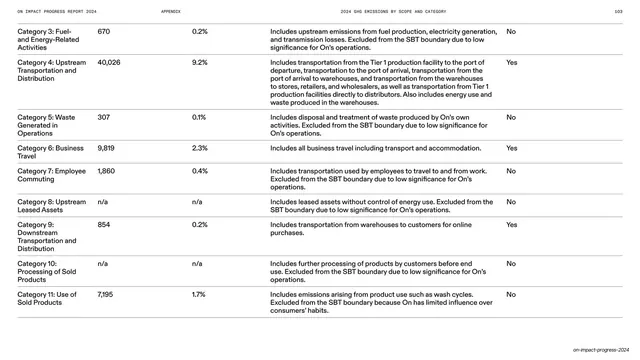
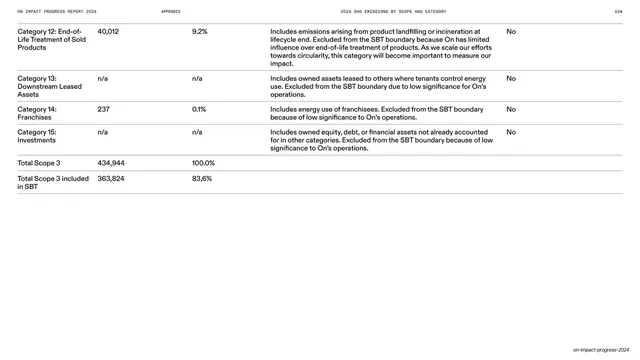
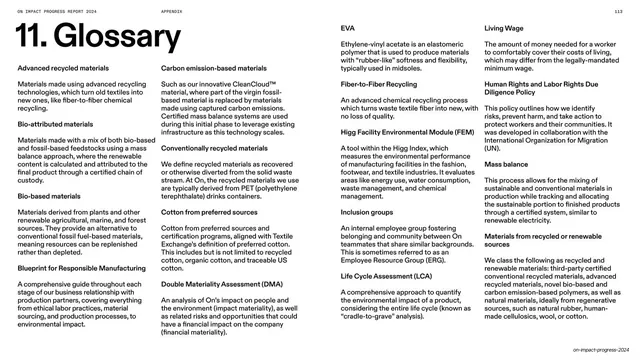
Light appendix table with a numbered headline over a three-column activity-data table grouped by Scope, with long descriptive cells in black on white.
Summary
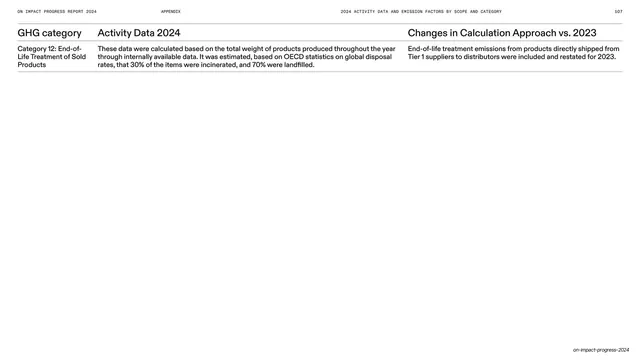
A second data table: a numbered "7. 2024 Activity Data and Emission Factors by Scope and Category" headline over a three-column table (GHG category, Activity Data 2024, Changes in Calculation Approach vs. 2023), grouped by Scope, in black on white.
Visual description
A white slide with the all-caps running header ("ON IMPACT PROGRESS REPORT 2024", centered "APPENDIX", page number "105"). An oversized black sans-serif headline "7. 2024 Activity Data and Emission Factors by Scope and Category" runs across two lines at the top. Below, a three-column table: a left category label, a wide middle column of long descriptive paragraphs explaining the activity-data approach, and a right column noting changes versus 2023. Grey scope-band rows ("Scope 1", "Scope 2", "Scope 3") group the entries, and hairline rules separate every row. The table fills the lower three-quarters.
Key takeaway
A description-heavy table that carries full sentences in its cells rather than just numbers, using a wide middle column for the explanation and a narrow right column for deltas. The same grey scope bands and hairline rules tie it visually to the numeric table earlier in the appendix, so the two read as a matched pair.
Reuse notes
Reusable when a table needs to hold qualitative detail (methods, assumptions, year-over-year changes) rather than figures. The wide-middle, narrow-right column ratio handles long text plus short notes. Reuse the scope-band grouping to keep parallel tables consistent across the appendix.
From this deck: 2024 activity data and emission factors table
View deck



































More like this




Keep what you find
A free account saves references to boards and can send you a weekly email of picks based on what you save.
To see every result, go Pro.