Preview image. Unlock full-res
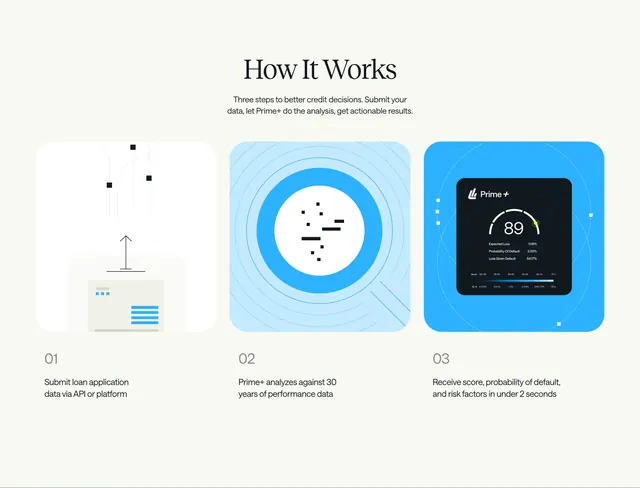
Centered How It Works section with three illustrated step columns showing submit, analyze, and receive score workflow.
Summary
Three-step How It Works process with custom illustrations for API submit, 30-year data analysis, and sub-two-second score delivery.
Visual description
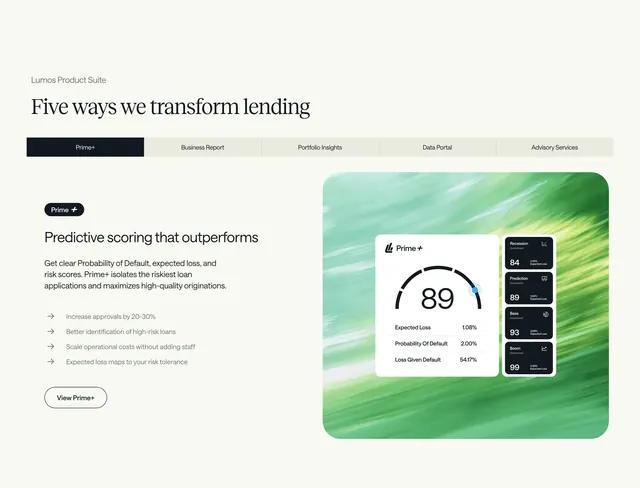
Cream background. Centered large serif How It Works heading and gray subtext on three steps to better credit decisions. Three equal columns: Step 01 white rounded square with document-and-network line illustration, label 01, text Submit loan application data via API or platform; Step 02 light blue rounded square with concentric circle and data-bar illustration, label 02, text Prime+ analyzes against 30 years of performance data; Step 03 vibrant blue rounded square with dark Prime+ dashboard card showing gauge 89 and loss metrics, label 03, text Receive score probability of default and risk factors in under 2 seconds.
Key takeaway
Escalating blue intensity across step containers implies progression toward the product UI reveal. Final step showing real dashboard UI closes the abstract-to-concrete loop.
Reuse notes
API and scoring product onboarding sections. Three columns need distinct illustrations; final UI card is the payoff.