Preview image. Unlock full-res
White slide with a black all-caps results headline over three growing yellow-and-pink donut charts showing first-party order share rising from 18 to 49 percent.
Summary
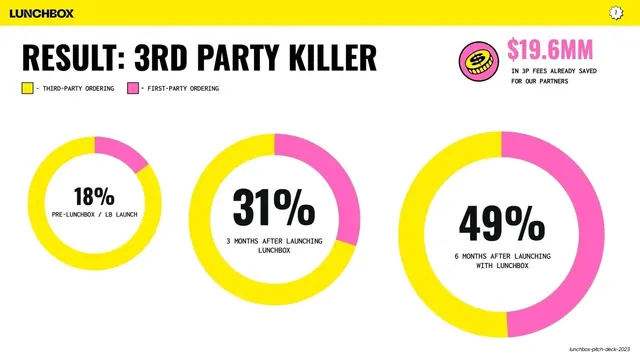
A results slide, "RESULT: 3RD PARTY KILLER," using three progressively larger donut charts to show first-party ordering rising from 18% to 31% to 49% after launching Lunchbox.
Visual description
White background, yellow chrome bar with wordmark and "7" badge. A heavy black condensed all-caps headline reads "RESULT: 3RD PARTY KILLER," with a small two-swatch legend beneath it (yellow = Third-Party Ordering, pink = First-Party Ordering). Top-right, a pink coin-stack illustration sits beside a large pink "$19.6MM" with the caption "IN 3P FEES ALREADY SAVED FOR OUR PARTNERS." The main area holds three yellow-and-pink donut charts that grow in diameter left to right, each with its pink (first-party) wedge getting larger: "18% Pre-Lunchbox / LB Launch," "31% 3 Months After Launching Lunchbox," and "49% 6 Months After Launching With Lunchbox," with the percentage set large in black in each donut's center.
Key takeaway
Showing growth by literally scaling the chart, three donuts increasing in size as the metric climbs, so the trend reads instantly before you read a number. Pairing the chart story with one big dollar-saved callout gives both the trend and the headline outcome.
Reuse notes
A clean results or traction slide for any before/after metric that improves over time. The grow-the-donut progression is a reusable way to make a three-point trend feel kinetic in a still slide. Keep the two-color legend consistent with the chart fills. Best when the numbers genuinely climb; a flat or noisy trend would undercut the escalating-size device.