Preview image. Unlock full-res
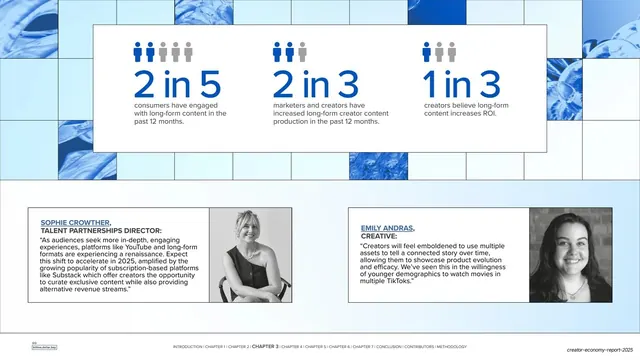
Statistics slide with three blue people-icon pictographs and oversized ratio stats in a white card up top, and two bordered expert-quote cards with headshots below.
Summary
A statistics slide: three ratio stats ("2 in 5", "2 in 3", "1 in 3") each illustrated with a row of blue people icons inside a white card up top, and two bordered expert-quote cards with black-and-white headshots below.
Visual description
The frame sits on a pale grid of faint blue duotone tiles. A wide white card across the top holds three columns, each with a small isotype-style row of five people icons (some filled blue, some grey to show the ratio), a large stat ("2 in 5", "2 in 3", "1 in 3") in blue, and a short caption. Below the card, two bordered quote cards sit side by side: "SOPHIE CROWTHER," (TALENT PARTNERSHIPS DIRECTOR) and "EMILY ANDRAS," (CREATIVE), each with an underlined name, caps role, a quote, and a square black-and-white headshot. The footer runs beneath with CHAPTER 3 bolded.
Key takeaway
The isotype pictograph: encoding each ratio as a row of filled-versus-grey people icons makes "2 in 5" instantly visual before the reader even reads the number. Pairing one stat card with two side-by-side quote cards shows the quote component tiling cleanly when multiple voices are needed.
Reuse notes
Reuse for proportional stats where a fraction or ratio matters more than a raw percentage; the people-icon pictograph communicates the proportion at a glance. The dual quote cards are a good pattern when two experts weigh in on the same data. Keep the icon style and quote-card recipe consistent with the rest of the deck.
From this deck: Long-form adoption pictograph stats
View deck

















More like this







Keep what you find
A free account saves references to boards and can send you a weekly email of picks based on what you save.
To see every result, go Pro.