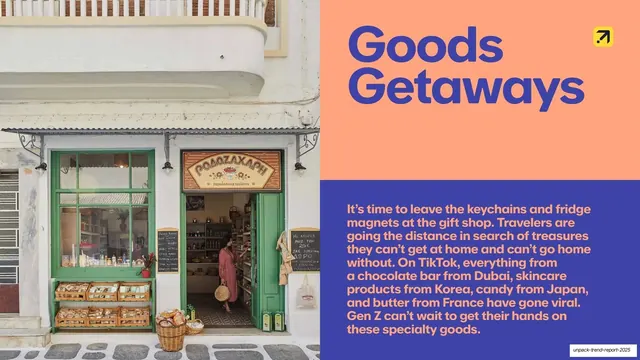
Preview image. Unlock full-res
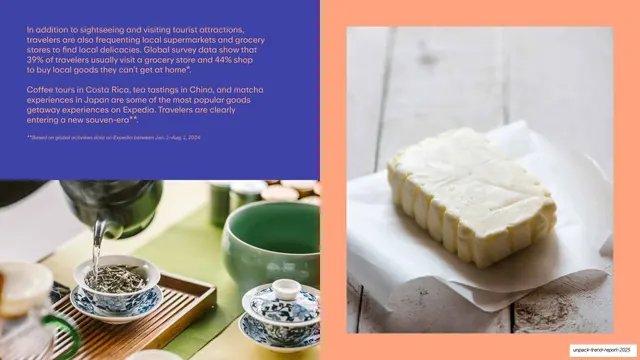
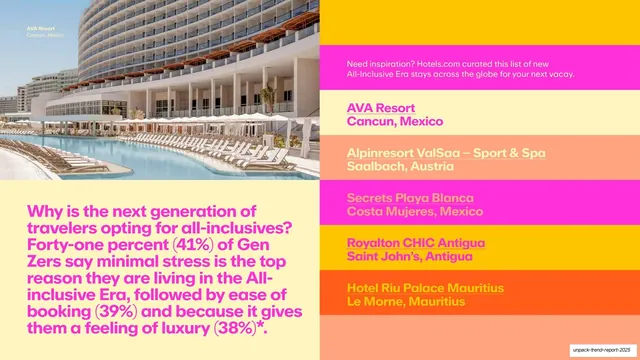
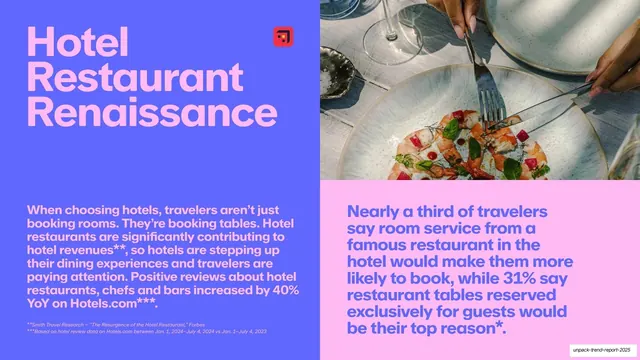
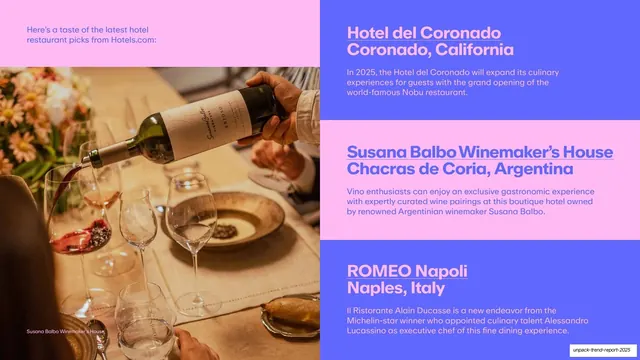
Goods Getaways data slide with two blue stat paragraphs over a tea-ceremony photo and a close-up of French butter on peach.
Summary
A Goods Getaways data slide: a blue panel holds two stat-led paragraphs over a tea-ceremony photo, beside a peach panel framing a close-up of French butter.
Visual description
The slide is a four-cell arrangement. The upper-left is a royal-blue (#3B3BD8) panel with two short white paragraphs citing survey figures (39% visit a grocery store, 44% shop for local goods) and a small italic footnote. Below it is a photograph of a Chinese tea ceremony with cups and a teapot pouring. The right half is a peach (#F4A47A) panel framing a centered close-up photograph of a block of cut butter on parchment. The blue/peach pairing and white stat copy continue the Goods Getaways coding.
Key takeaway
Embedding statistics inside short narrative paragraphs on the color block rather than as big numerals, keeping the deck's editorial voice while still delivering data. The tightly cropped single-object photo (butter) reads as a graphic, not just a snapshot.
Reuse notes
Good for a data slide that wants prose-with-stats instead of a chart. The quadrant layout balances two photos against one text block; swap any cell for your own. Footnotes in small italic keep sourcing visible without clutter.
From this deck: Goods Getaways data (grocery and souvenirs)
View deck









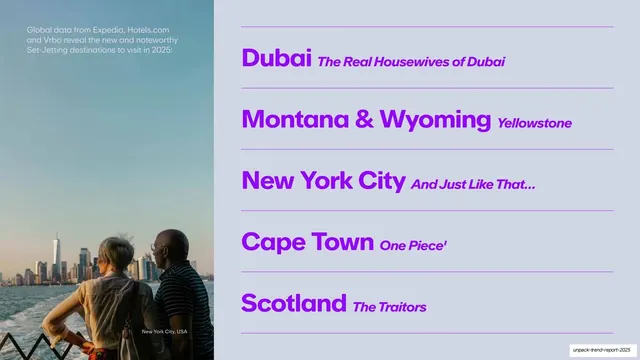
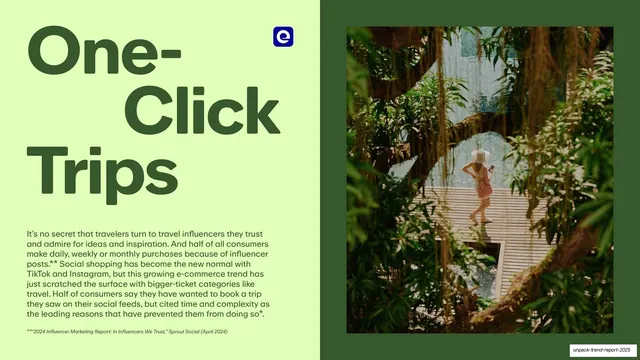
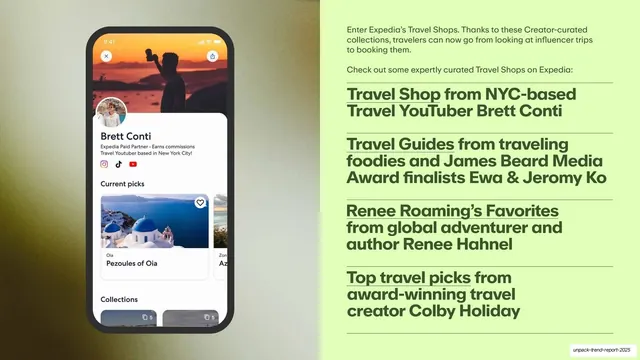

More like this



Keep what you find
A free account saves references to boards and can send you a weekly email of picks based on what you save.
To see every result, go Pro.