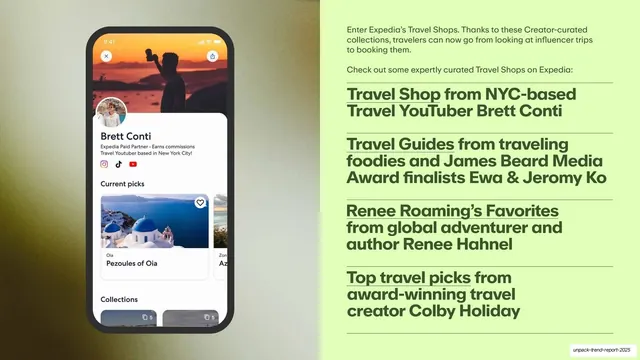
Preview image. Unlock full-res
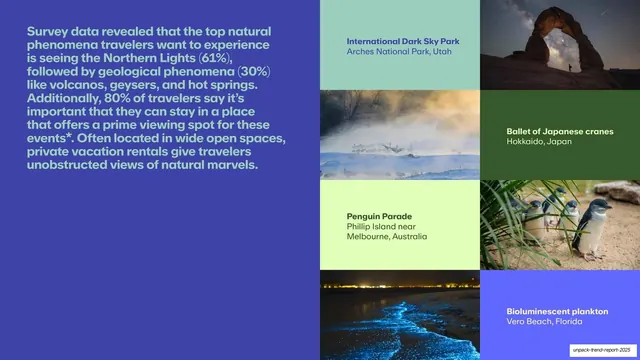
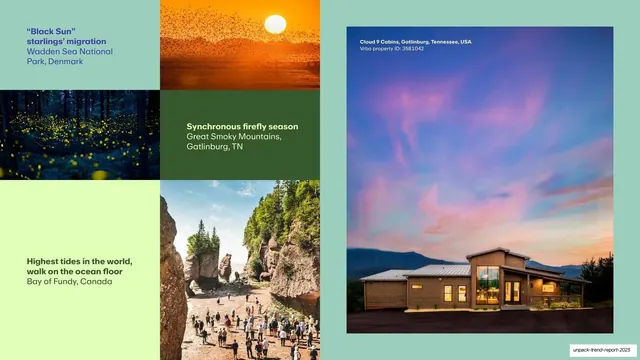
A phenomena destinations grid pairing labeled color cells with nature photos and a tall pink-sky cabin photo on the right.
Summary
A phenomena destinations grid: mint and green label cells interleaved with nature photos at left, and a tall pink-sky timber-cabin photo at right.
Visual description
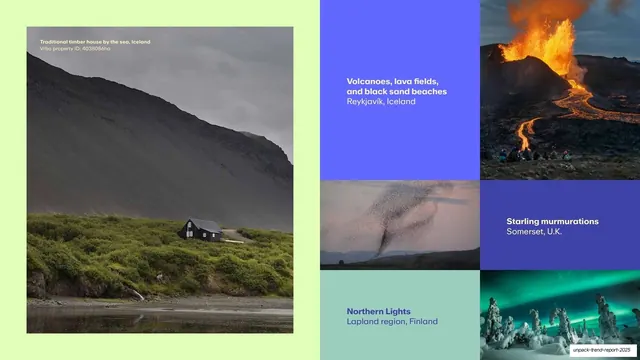
The slide repeats the phenomena mosaic grammar. The left two-thirds is a bento of flat mint (#A7D8C9) and green (#3F5A1E) label cells carrying place names ("Black Sun starlings' migration, Wadden Sea National Park, Denmark"; "Synchronous firefly season, Great Smoky Mountains, Gatlinburg, TN"; "Highest tides in the world, walk on the ocean floor, Bay of Fundy, Canada") interleaved with photos of a starling cloud at sunset, a firefly forest, and crowds on the ocean floor. The right third is a tall photograph of a timber cabin under a pink dusk sky (Cloud 9 Cabins, Gatlinburg) with a caption and Vrbo property ID. Palette and layout match the other phenomena grids.
Key takeaway
The disciplined reuse of one mosaic template across the whole phenomena run, so the section's data slides form a consistent gallery. Label cells in flat color keep captions legible and on-palette beside busy nature photos.
Reuse notes
A duplicate-and-edit grid for multi-slide example sets. Keep cell sizing, label style, and the tall side photo fixed so the slides read as a series. Swap only photos and labels for each page.
From this deck: Phenomena destinations grid (viewing access)
View deck




More like this




Keep what you find
A free account saves references to boards and can send you a weekly email of picks based on what you save.
To see every result, go Pro.