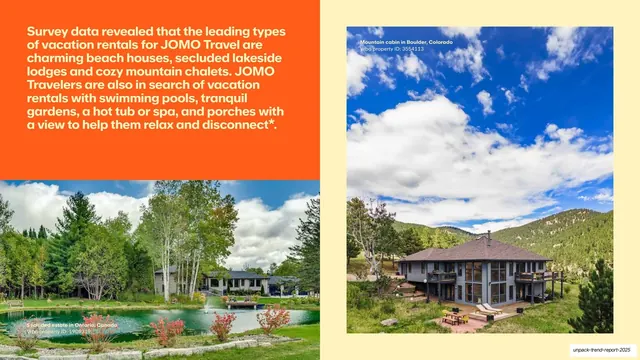
Preview image. Unlock full-res
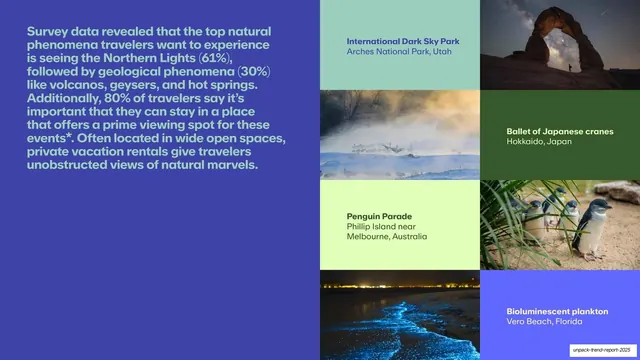
Phenomena data slide with a blue stat paragraph on the left and a labeled grid of natural-wonder photos and color cells on the right.
Summary
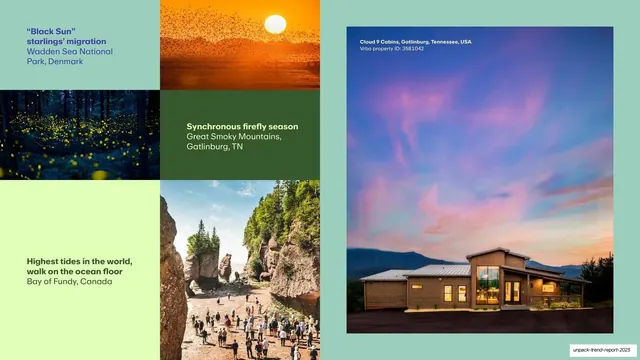
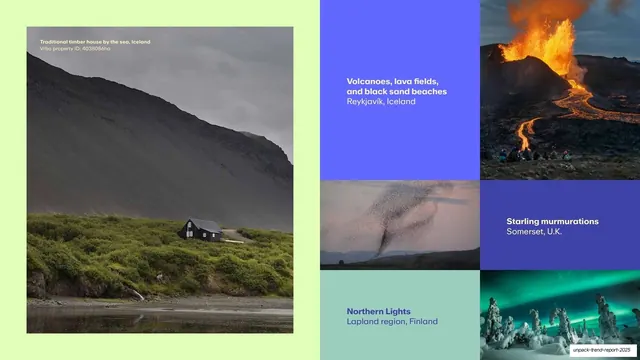
A Phenomena-List data slide: a large blue stat paragraph fills the left while the right is a labeled mosaic of natural-wonder photos interleaved with flat-color caption cells.
Visual description
The left half is a royal-blue (#3B3BD8) panel with a large block of white-and-pale body copy citing stats (61% Northern Lights, 30% geological phenomena, 80% want a prime viewing spot). The right half is a grid mosaic alternating photographs (Arches National Park, Japanese cranes in Hokkaido, a penguin parade, bioluminescent plankton) with flat-color cells in mint and lime that carry the place labels in dark type. The mosaic packs four captioned wonders into a tidy bento.
Key takeaway
The bento mosaic that alternates photo cells with flat-color label cells, so captions live in their own colored tiles rather than overlaid on images. It keeps a dense, multi-image data slide readable and on-palette.
Reuse notes
Ideal when you need to show four or more examples with labels on one slide. Putting each label in its own color cell avoids text-over-photo legibility problems. Balance the grid so photo and color cells alternate rather than clustering.
From this deck: Phenomena-List data with photo grid
View deck








More like this






Keep what you find
A free account saves references to boards and can send you a weekly email of picks based on what you save.
To see every result, go Pro.