
Preview image. Unlock full-res
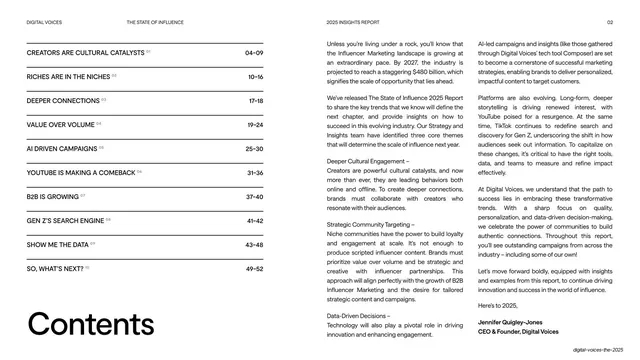
Light slide with a descending staircase of colored bars sized to hashtag view volumes on the right, body copy and an oversized "The Power of Niche" headline on the left.
Summary
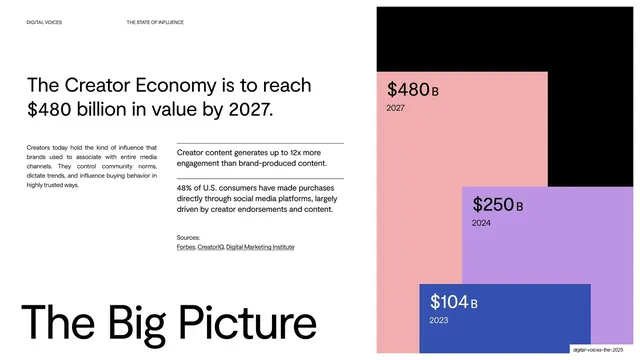
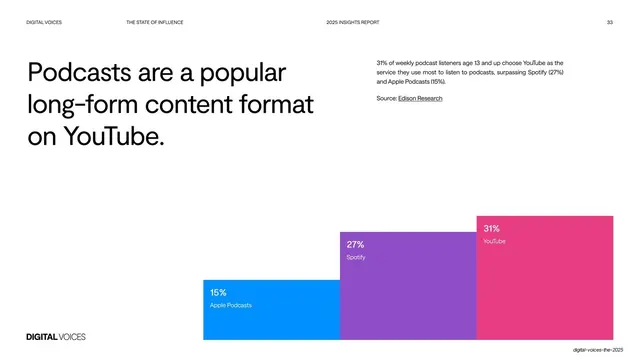
A light data slide: a descending staircase of full-width colored bars on the right ranks hashtag view volumes (#fortnite 665B down to #comfortfood 16B), with body copy and an oversized "The Power of Niche" headline filling the left.
Visual description
White background with the top utility header and page number ("15"). The right two-thirds is a chart of six stacked horizontal bars stepping down in both width and vertical position like a staircase, each a different flat color (green, peach, crimson, sky-blue, royal-blue, light-orange) and labeled to its left with a hashtag and view count (#fortnite 665B, #booktok 323B, #NBA 311B, #studytok 37B, #moneytok 33B, #comfortfood 16B). The left holds a single justified paragraph and an oversized lowercase "The Power of Niche" headline along the bottom.
Key takeaway
A ranked-bar chart drawn as a colored descending staircase rather than a standard bar graph, with labels sitting in the white space to each bar's left. It makes a long-tail comparison feel designed and on-brand, and the per-bar color coding adds energy to a data page.
Reuse notes
Useful for any ranked list of values (top hashtags, channels, categories) where the magnitudes vary widely. The staircase reads cleanly with five to seven items; more would crowd the labels. Pairs with the deck's other light data slides and its oversized lowercase footers.
From this deck: The power of niche hashtag chart
View deck




















More like this



Keep what you find
A free account saves references to boards and can send you a weekly email of picks based on what you save.
To see every result, go Pro.