Preview image. Unlock full-res
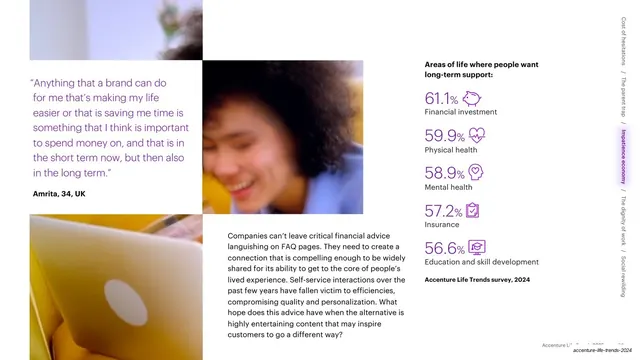
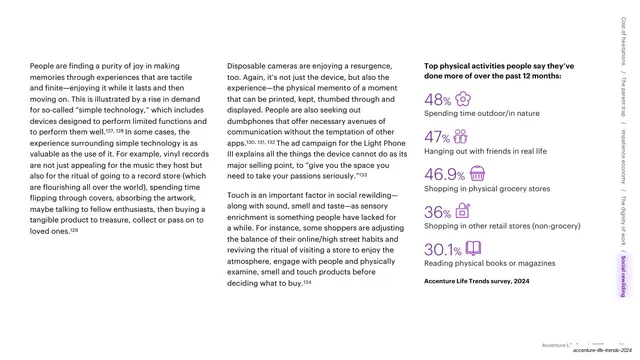
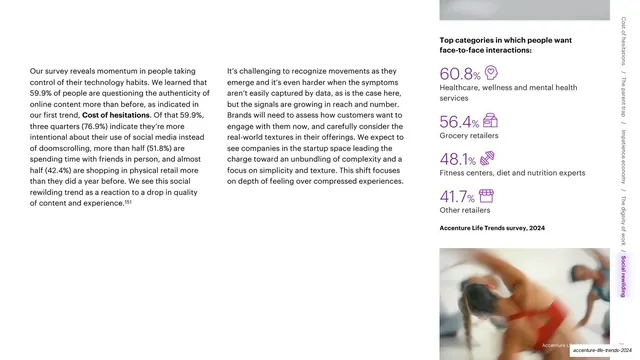
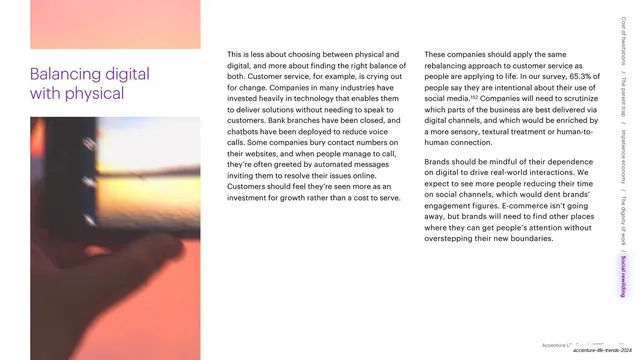
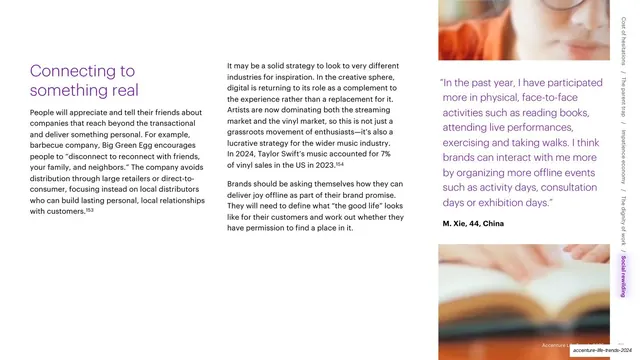
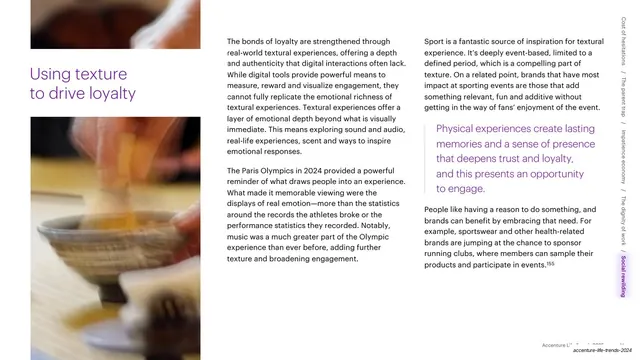
A data slide pairing a colored pull-quote and two blurred photos on the left with a ranked list of five large purple percentages, each with a small icon, on the right.
Summary
A data slide listing the areas of life where people want long-term support: a colored pull-quote and two blurred photos on the left, and a ranked list of five oversized purple percentages with small icons on the right.
Visual description
The left third stacks a small blurred photo, a gold-and-teal pull-quote ("Anything that a brand can do for me that's making my life easier...") closed by a bold "Amrita, 34, UK", and a second blurred photo of a laptop. The center holds a single sharper photo of a smiling person. The right column is a ranked list: "Areas of life where people want long-term support:" over five rows, each a large purple percentage (61.1% Financial investment, 59.9% Physical health, 58.9% Mental health, 57.2% Insurance, 56.6% Education and skill development) with a small purple line icon, closed by a bold "Accenture Life Trends survey, 2024".
Key takeaway
The ranked stat list, where five descending percentages each get an oversized purple number and a small topical icon, turning survey data into a scannable visual ranking without a chart. Pairing it with a human pull-quote balances data and voice.
Reuse notes
A clean way to present a ranked survey breakdown when a bar chart would feel heavy; the oversized-number list reads fast and stays on-brand. Reuse for "top five" style findings. Keep icons simple and uniform so the numbers stay the focus.
From this deck: Areas of life ranked stat list with quote and photos
View deck












More like this







Keep what you find
A free account saves references to boards and can send you a weekly email of picks based on what you save.
To see every result, go Pro.