Preview image. Unlock full-res
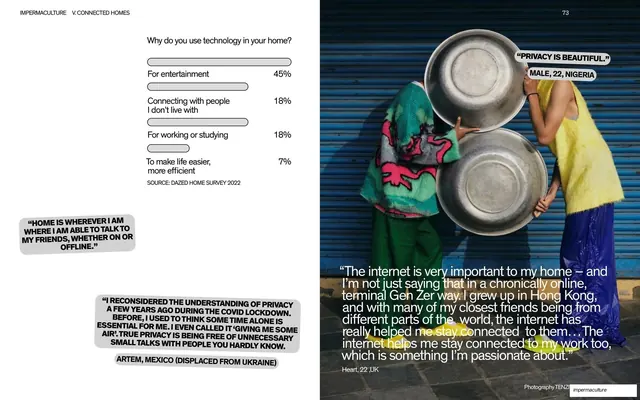
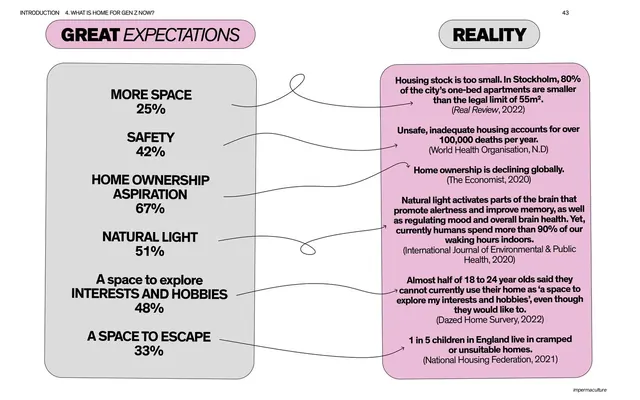
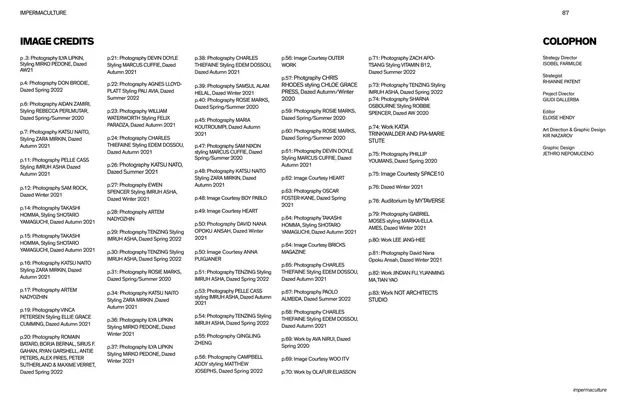
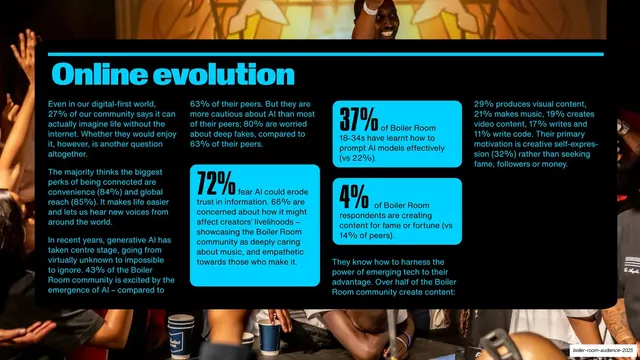
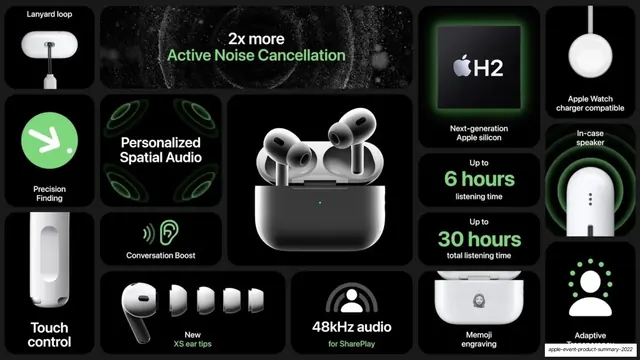
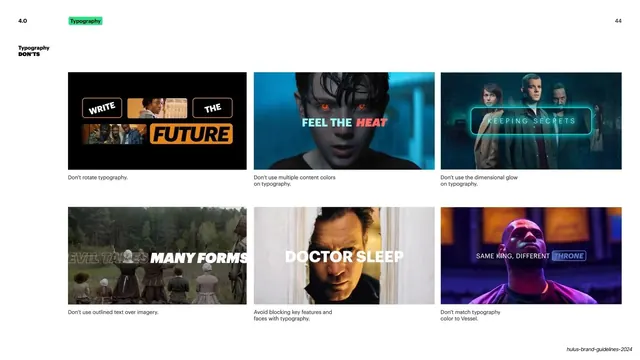
Two-page spread pairing a left-column bar breakdown of why people use home technology with scattered participant quote-cards and a full-bleed editorial photo right.
Summary
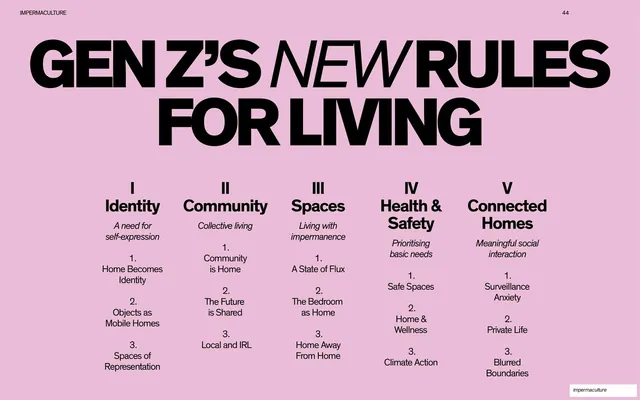
A magazine-style data spread: the left page poses "Why do you use technology in your home?" with a four-row percentage breakdown and floating quote-cards, while the right page is a full-bleed editorial photo overlaid with a long participant testimony.
Visual description
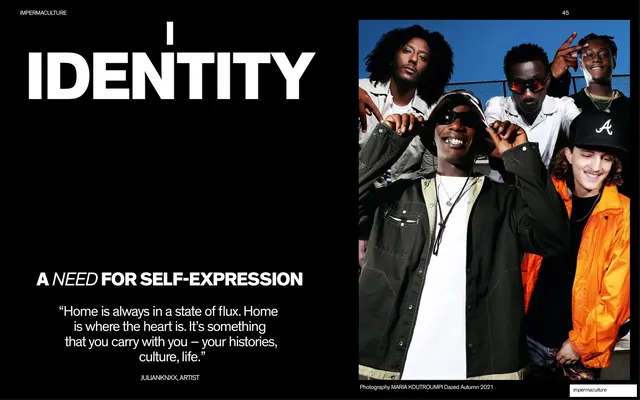
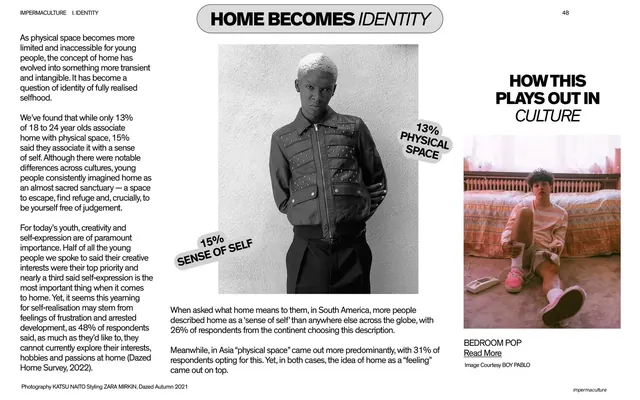
The left page is white with a section header "IMPERMACULTURE V. CONNECTED HOMES" top-left and page "73" top-right. A question heading "Why do you use technology in your home?" sits above a four-item list with thin progress-bar rules and right-aligned percentages (For entertainment 45%, Connecting with people 18%, For working or studying 18%, To make life easier 7%), sourced to "DAZED HOME SURVEY 2022". Two black quote-cards in white caps float lower-left with participant attributions ("ARTEM, MEXICO (DISPLACED FROM UKRAINE)"). The right page is a saturated photo of two people bending to hold large metal pans against a blue corrugated wall; a small black quote-card top-right reads "PRIVACY IS BEAUTIFUL. MALE, 22, NIGERIA" and a long white testimony about staying connected is set over the lower image, with a vertical photo credit and the white "impermaculture" badge bottom-right.
Key takeaway
Turning survey data into a designed spread: lightweight bar rules plus big percentages on the left, balanced against a photographic right page. The floating black quote-cards let real voices interrupt the data without a rigid grid, and reversing one short quote onto the image keeps both pages in conversation.
Reuse notes
A reusable pattern for any research or report deck that needs to show a small dataset alongside qualitative quotes and imagery. The bar-and-percentage list is a clean, low-ink chart style. Works best when the right-hand photo is strong enough to carry overlaid white text; keep the quote-cards short so they read at a glance.
From this deck: Why people use technology at home data spread
View deck




































More like this


Keep what you find
A free account saves references to boards and can send you a weekly email of picks based on what you save.
To see every result, go Pro.