Preview image. Unlock full-res
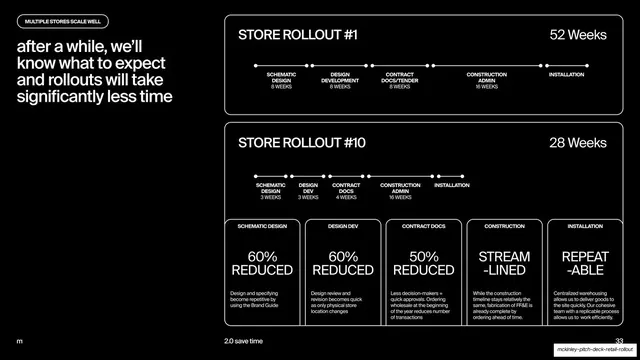
Black slide comparing a 52-week first store rollout against a 28-week tenth rollout, with phase node timelines and a row of percentage-reduction cards.
Summary
A black slide proving that rollouts speed up at scale: a 52-week first store versus a 28-week tenth store, each as a phase node timeline, with the tenth backed by five percentage-reduction cards.
Visual description
Pure black background. Top-left, a small pill label "MULTIPLE STORES SCALE WELL" sits above a four-line headline, "after a while, we'll know what to expect and rollouts will take significantly less time". The right two-thirds stacks two outlined panels. "STORE ROLLOUT #1" shows a horizontal node timeline (Schematic Design 8 wks, Design Development 8, Contract Docs/Tender 8, Construction Admin 16, Installation) totaling "52 Weeks" in large type. "STORE ROLLOUT #10" shows a compressed timeline (3, 3, 4, 16 wks) totaling "28 Weeks", and below it a five-column card row: "60% REDUCED", "60% REDUCED", "50% REDUCED", "STREAM-LINED", "REPEAT-ABLE", each with a small caption explaining why. Footer: "m", "2.0 save time", page "33".
Key takeaway
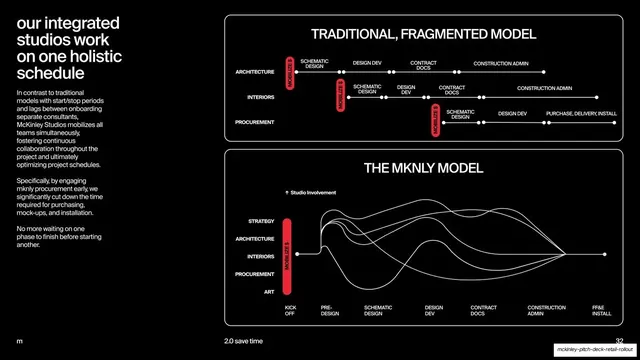
Putting two comparable node timelines one above the other with their totals (52 vs 28 weeks) in big type, then turning the explanation into a card row of percentage reductions. The reused timeline format from the prior slide makes the speedup self-evident.
Reuse notes
A persuasive "it gets faster and cheaper at scale" slide for rollout, franchise, or repeatable-delivery pitches. Reuse the node-timeline component across process slides for consistency. The combined timelines plus cards are dense; lead with the two week-count totals when presenting.
From this deck: Store rollout 1 vs 10 timeline comparison
View deck




































More like this







Keep what you find
A free account saves references to boards and can send you a weekly email of picks based on what you save.
To see every result, go Pro.