Preview image. Unlock full-res
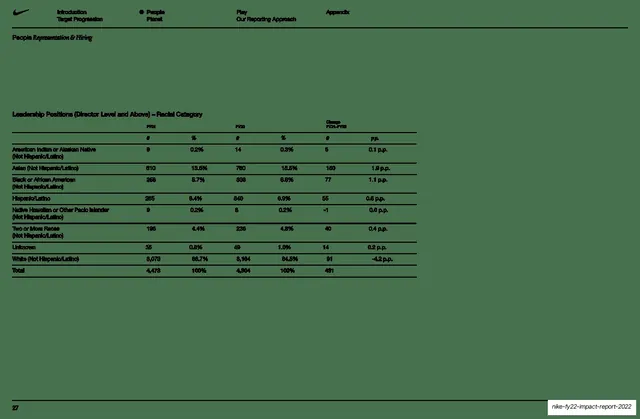
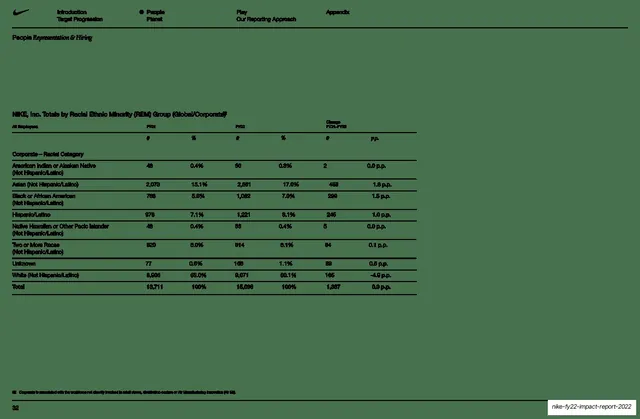
Sage-green slide carrying a single wide multi-column data table of leadership representation by racial category across FY21, FY22, and change.
Summary
A near-pure data table page: one wide table titled "Leadership Positions (Director Level and Above) - Racial Category" sits on the sage-green field, listing counts and percentages for FY21, FY22, and the year-over-year change across racial categories.
Visual description
Muted sage-green background with a lot of empty space above and below. A single wide table runs across the upper-middle of the page. Its header groups three column pairs (FY21, FY22, Change FY21-FY22), each split into "#" and "%" sub-columns, with a final p.p. column. Rows list racial categories (American Indian or Alaskan Native, Asian, Black or African American, Hispanic/Latino, Native Hawaiian or Other Pacific Islander, Two or More Races, Unknown, White) and a bold Total row, separated by thin hairline rules. Type is small dark sans throughout. Nike running header and "People Representation & Hiring" label on a hairline at top; page number 27 bottom-left.
Key takeaway
The discipline of giving a complex table its own quiet page with generous margins, using only hairline rules and a clear grouped header rather than fills or zebra striping. Grouping each year into #/% pairs with a change column makes the comparison readable at a glance.
Reuse notes
A reference for the appendix-style data slide every serious report needs. Reusable for any demographic, financial, or survey breakdown that must show raw figures honestly. Let the table breathe on its own page; resist adding chrome. Keep alignment and decimal precision consistent down every column.
From this deck: Leadership positions by racial category data table
View deck
























More like this





Keep what you find
A free account saves references to boards and can send you a weekly email of picks based on what you save.
To see every result, go Pro.