Preview image. Unlock full-res
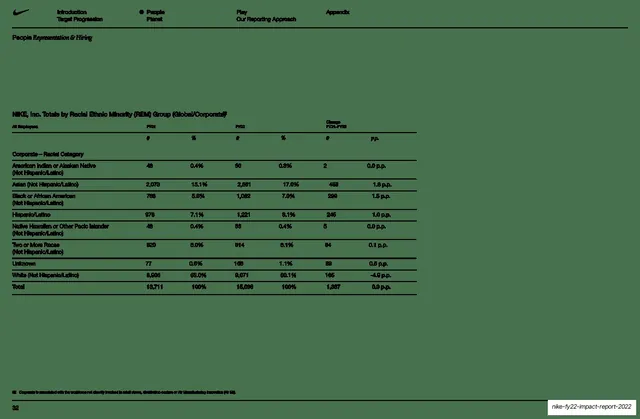
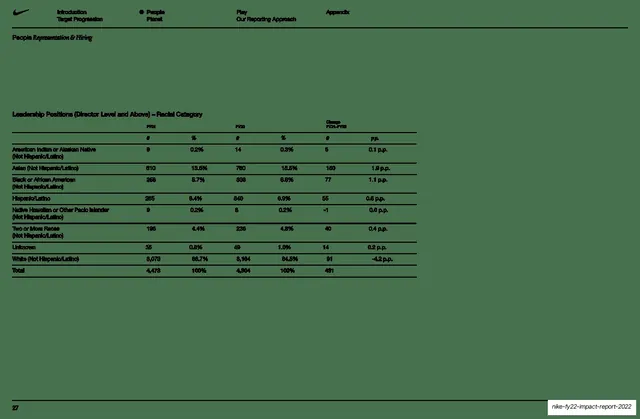
Sage-green slide carrying a single wide multi-column data table of corporate workforce demographics by racial category across FY21, FY22, and change.
Summary
A second data-table page matching slide 27: one wide table titled "NIKE, Inc. Totals by Racial Ethnic Minority (REM) Group (Global/Corporate)" lists corporate workforce counts and percentages for FY21, FY22, and the year-over-year change by racial category.
Visual description
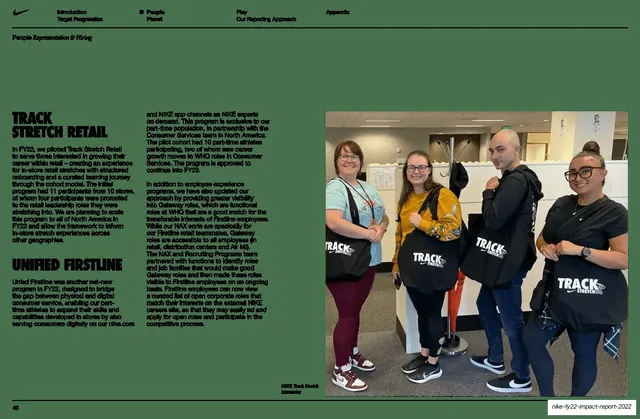
Muted sage-green background with generous empty space. A single wide table sits in the upper-middle. Its header groups three column pairs (FY21, FY22, Change FY21-FY22) each split into "#" and "%" sub-columns plus a p.p. column, with a "Corporate - Racial Category" sub-label. Rows list racial categories and a bold Total, separated by thin hairline rules, in small dark sans type. A small footnote runs along the bottom defining "Corporate". The Nike running header and "People Representation & Hiring" label sit on a hairline at top; page number 32 bottom-left.
Key takeaway
The same restrained single-table treatment repeated for a second dataset, proving the pattern scales: hairline rules, grouped #/% headers, a change column, a defining footnote, and lots of margin. Consistency between the two table pages makes them read as a matched appendix pair.
Reuse notes
Reuse alongside slide 27 as a paired data appendix. The footnote-at-bottom convention is worth keeping for any table whose terms need defining. Keep the two tables visually identical so readers transfer how to read one to the other. Resist fills, color, or zebra striping; the hairlines do enough.
From this deck: NIKE totals by racial ethnic minority group data table
View deck









More like this




Keep what you find
A free account saves references to boards and can send you a weekly email of picks based on what you save.
To see every result, go Pro.