Preview image. Unlock full-res
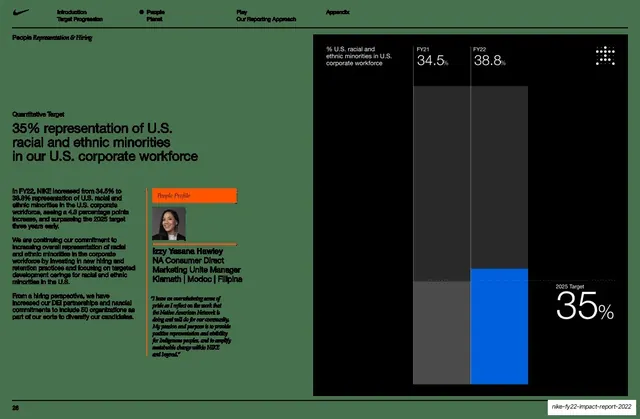
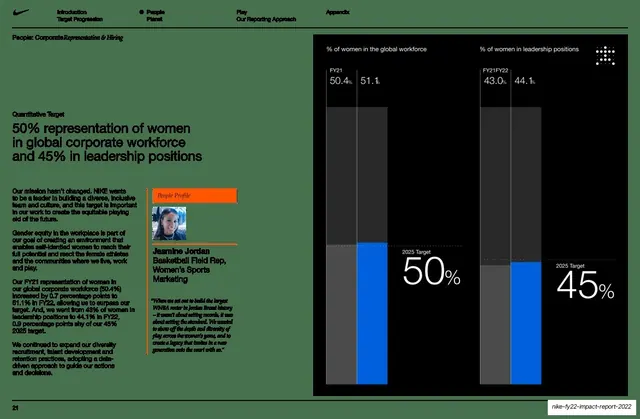
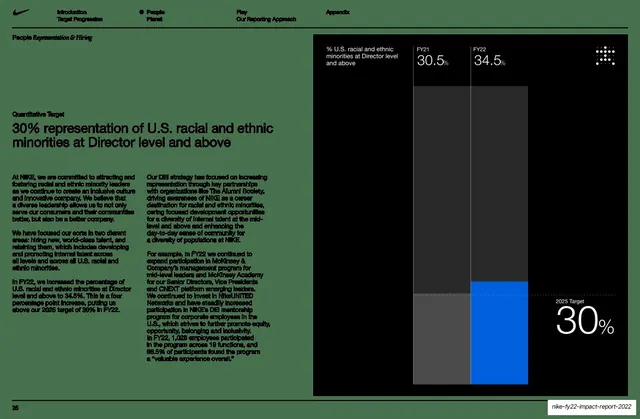
Quantitative-target data slide with a left goal statement and an orange-tabbed profile card, beside a near-black panel holding one FY21-to-FY22 bar chart and an oversized white 35% target.
Summary
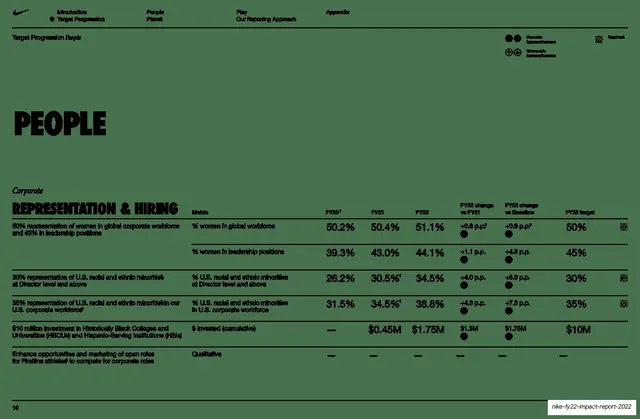
A quantitative-target data slide following the deck's KPI template: the left states the 35% U.S. minority workforce goal with body copy and an orange-tabbed "People Profile" card; the right is a near-black panel with one FY21-vs-FY22 bar comparison (34.5% to 38.8%) and a giant white "2025 Target 35%".
Visual description
Left half is sage-green. A "Quantitative Target" label tops a medium sans headline ("35% representation of U.S. racial and ethnic minorities in our U.S. corporate workforce"), then short body paragraphs and an orange-tabbed "People Profile" card with a headshot (Izzy Yasana Hawley), name, title, tribal affiliations, and a small italic quote. The right half is a tall near-black panel with a grouped bar chart, "% U.S. racial and ethnic minorities in U.S. corporate workforce" (FY21 34.5%, FY22 38.8%) as a dark-grey and a bright-blue bar, with an oversized white "2025 Target 35%" lower-right. A dotted-square mark sits top-right. Nike running header on top; page 28 bottom-left.
Key takeaway
The exact reuse of one KPI frame (narrative-left, profile card, dark data panel, greyscale prior bar, blue current bar, giant target) across yet another metric. This systematic repetition is the whole point: variety of content, zero variety of structure, so the section reads as one coherent dataset.
Reuse notes
Drop-in template for any target-tracking metric in an impact or DEI report. The orange profile card again humanizes the stats. Keep the layout identical slide to slide so the reader learns to read it once; change only the numbers, the chart, and the featured person.
From this deck: 35% U.S. minority workforce target with bar chart
View deck







More like this


Keep what you find
A free account saves references to boards and can send you a weekly email of picks based on what you save.
To see every result, go Pro.