Preview image. Unlock full-res
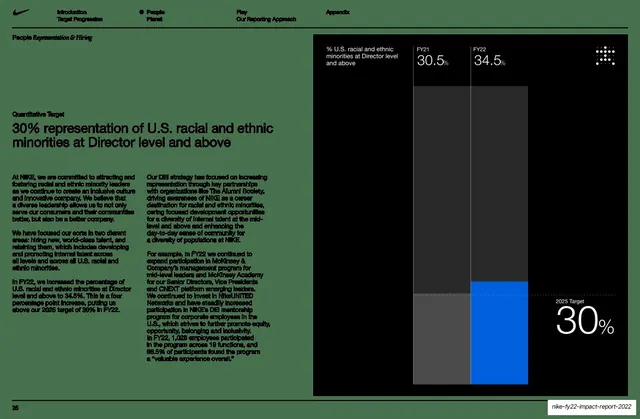
Quantitative-target data slide with a left goal statement and two body columns, beside a near-black panel holding one FY21-to-FY22 bar chart and an oversized white 30% target.
Summary
A quantitative-target data slide: the left states a 30% goal for U.S. racial and ethnic minorities at Director level with two columns of body copy; the right is a near-black panel with a single FY21-vs-FY22 bar comparison (30.5% to 34.5%) and a giant white "2025 Target 30%".
Visual description
Left half is sage-green: a small "Quantitative Target" label tops a medium sans headline ("30% representation of U.S. racial and ethnic minorities at Director level and above"), followed by two columns of small body copy. The right half is a tall near-black rectangle containing one grouped bar chart, "% U.S. racial and ethnic minorities at Director level and above" (FY21 30.5%, FY22 34.5%) rendered as a dark-grey bar and a bright-blue bar, with an oversized white "2025 Target 30%" set lower-right. A small dotted-square mark sits top-right. Nike running header on top; page 25 bottom-left.
Key takeaway
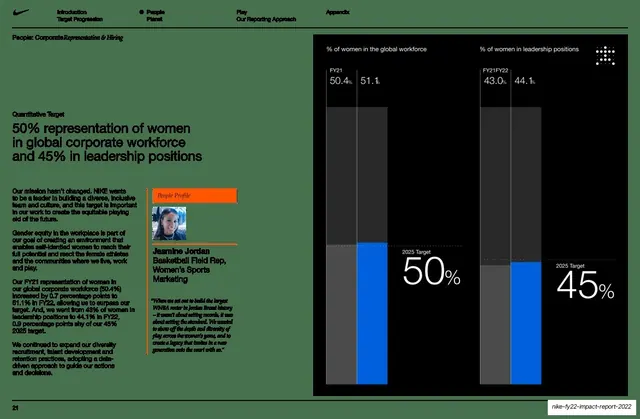
The consistent KPI template reused from slide 21 with a single chart this time: one dark data panel, greyscale prior-year bar, one blue current-year bar, and one oversized target number. Keeping the same frame across metrics makes a long data section feel systematic.
Reuse notes
Reuse for any single-metric target page in an impact, ESG, or DEI report. The fixed dark-panel-plus-one-blue-bar-plus-giant-target layout reads instantly and templates cleanly across many slides. Swap the accent color to brand; keep the prior year muted so the latest result pops.
From this deck: 30% U.S. minority Director representation target with bar chart
View deck




















More like this







Keep what you find
A free account saves references to boards and can send you a weekly email of picks based on what you save.
To see every result, go Pro.