Preview image. Unlock full-res
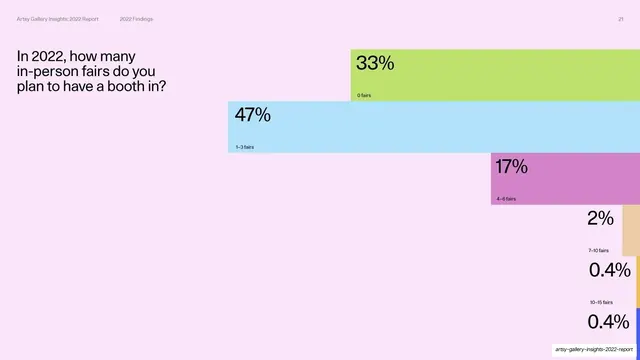
A stat slide on a pale-pink field where six overlapping color-block bars cascade down the right, each a percentage for a fair-count bucket.
Summary
A survey-question showcase on a pale-pink ground: the question "In 2022, how many in-person fairs do you plan to have a booth in?" at top-left, with six overlapping color bars cascading down the right, each holding a percentage and a fair-count label.
Visual description
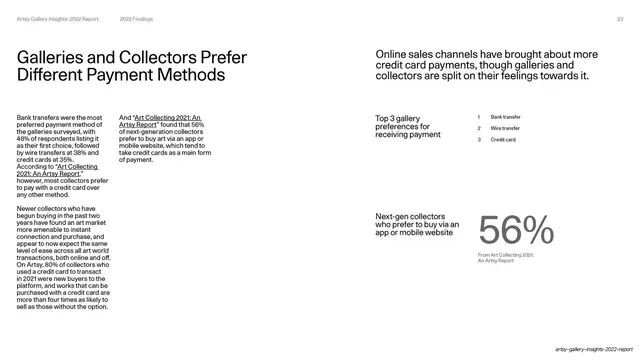
The slide is pale pink. Top-left: the question headline in medium black sans. Down the right two-thirds, six full-width-reaching horizontal rectangles in different colors (lime, sky-blue, orchid, peach, and pale tints) descend in an overlapping staircase, each carrying a large black percentage at its left edge (33%, 47%, 17%, 2%, 0.4%, 0.4%) with a small caption beneath (0 fairs, 1-3 fairs, 4-6 fairs, 7-10 fairs, 10-15 fairs, etc.). Each successive bar steps lower and overlaps the one above.
Key takeaway
The cascading overlapped-bar treatment reused for a single survey question with many answer buckets. Sizing each bar to its share and stacking them in a staircase shows the full distribution at a glance, including tiny tail values, while the soft pink ground keeps the multicolor bars cohesive.
Reuse notes
A reusable pattern for a single multiple-choice survey question with several options. Especially good when a few buckets dominate and a long tail of small ones remains, since even sub-1% bars stay legible. Match the background to a deck accent and keep captions short, anchored under each bar.
From this deck: How many in-person fairs do you plan to have a booth in?
View deck


More like this





Keep what you find
A free account saves references to boards and can send you a weekly email of picks based on what you save.
To see every result, go Pro.