Preview image. Unlock full-res
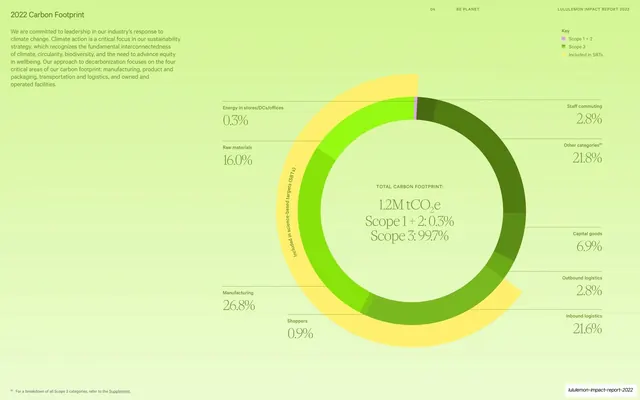
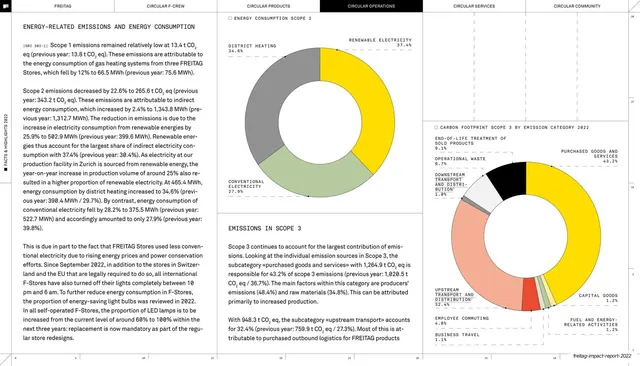
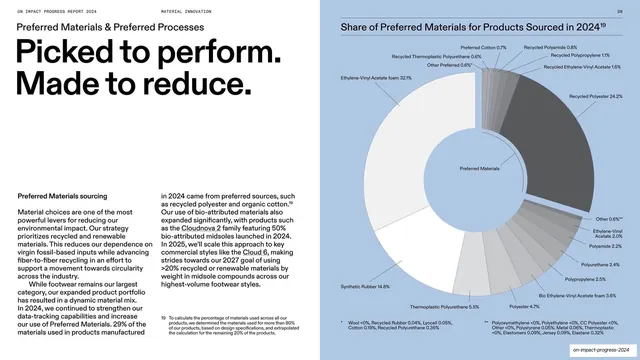
A large green donut chart breaking down lululemon's 1.2M tCO2e 2022 carbon footprint by category, with a center total and leader-line labels, on a green field.
Summary
The green-world counterpart to the earlier pie chart: a big donut chart of the 2022 carbon footprint in shades of green, with the headline total set inside the ring and category percentages pinned around it by leader lines.
Visual description
Pale green field. Top-left holds a small olive title "2022 Carbon Footprint" over a short intro paragraph; a compact "Key" legend sits top-right (Scope 1+2 in lilac, Scope 3 in green, Included in SBTs in pale yellow). A large donut chart fills the right two-thirds, its segments in graded greens with one lilac sliver and an outer pale-yellow arc marking the SBT-covered portion; a curved label "Included in science-based targets (SBTs)" follows that arc. The donut's hollow center carries the total in serif: "TOTAL CARBON FOOTPRINT: 1.2M tCO2e, Scope 1+2: 0.3%, Scope 3: 99.7%." Thin leader lines connect each segment to an outer label set in small caps over a serif percentage (Raw materials 16.0%, Manufacturing 26.8%, Other categories 21.8%, Inbound logistics 21.6%, Capital goods 6.9%, and several smaller). Footnote and wordmark along the bottom.
Key takeaway
Putting the headline number and scope split inside the donut's hole so the single most important figure sits at the optical center. Reusing the same chart-with-leader-lines pattern as the warm section, recolored to the chapter's palette, gives the report visual consistency across chapters.
Reuse notes
A clean approach for a single dominant breakdown where one total matters most. The center-of-donut total is a reliable focal device; the monochrome-green segments plus a tiny key keep many categories readable. Mirror the colorway to whatever section it lives in. As with most footprint charts, leader-line labels beat a crowded legend.
From this deck: 2022 Carbon Footprint donut chart, 1.2M tCO2e
View deck

More like this


Keep what you find
A free account saves references to boards and can send you a weekly email of picks based on what you save.
To see every result, go Pro.