Preview image. Unlock full-res
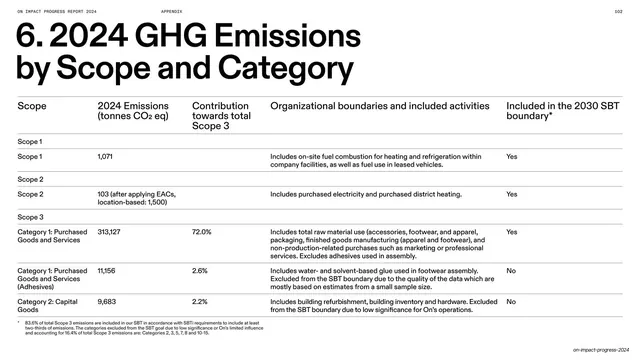
Light appendix data table with a numbered headline over a five-column emissions table grouped by Scope, set in black on white with hairline rules.
Summary
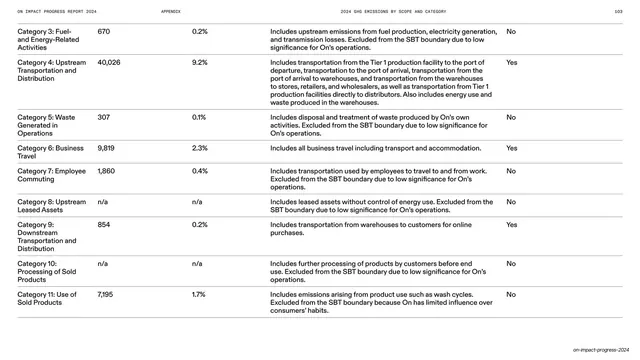
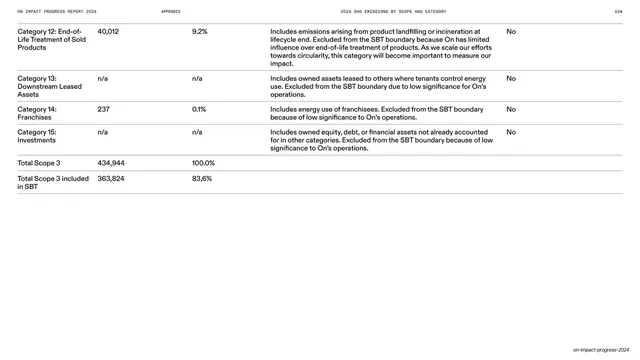
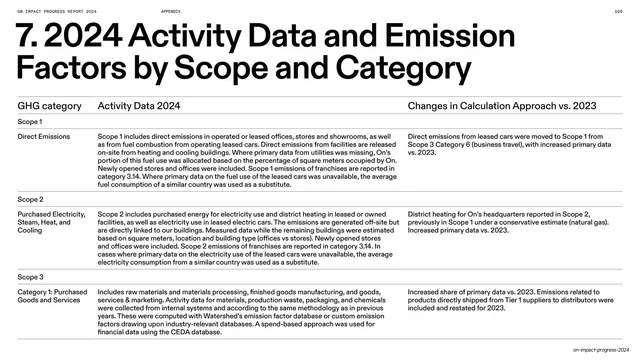
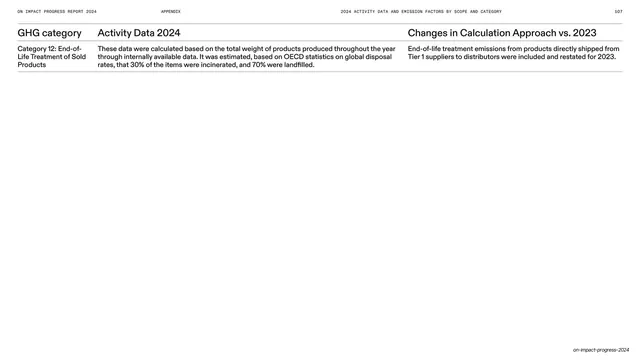
The main emissions data table: a numbered "6. 2024 GHG Emissions by Scope and Category" headline over a five-column table of figures, grouped under Scope 1 / Scope 2 / Scope 3, in black on white.
Visual description
A white slide. The all-caps running header carries "ON IMPACT PROGRESS REPORT 2024", a centered "APPENDIX", page number "102". An oversized black sans-serif headline "6. 2024 GHG Emissions by Scope and Category" runs across two lines at the top. Below sits a wide data table with five columns (Scope; 2024 Emissions tonnes CO2 eq; Contribution towards total Scope 3; Organizational boundaries and included activities; Included in the 2030 SBT boundary). Light grey scope band rows ("Scope 1", "Scope 2", "Scope 3") group the line items, and every row is separated by a thin hairline rule. A small footnote in grey sits beneath the table.
Key takeaway
The clean financial-report table treatment: hairline rules only (no fills or boxes), grey banded subheader rows to group categories, and a long descriptive column carried in small type so each figure has context. The numbered headline ties the table back to the methodology section.
Reuse notes
A directly reusable template for any emissions, financial, or metrics disclosure table. Hairline rules and grouped scope bands keep a dense grid legible without heavy chrome. Pair with the footnote line for caveats; reuse across consecutive pages when the table runs long (as it does here into the next slides).
From this deck: 2024 GHG emissions by scope and category table
View deck


































































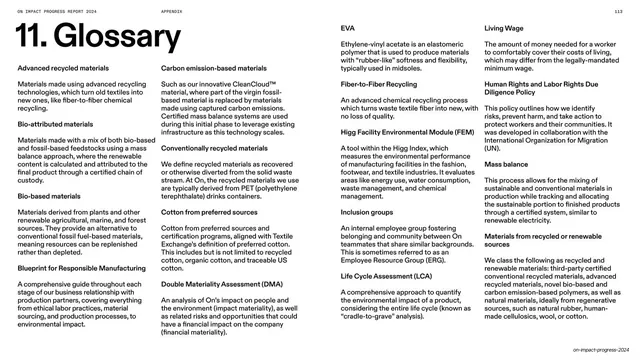
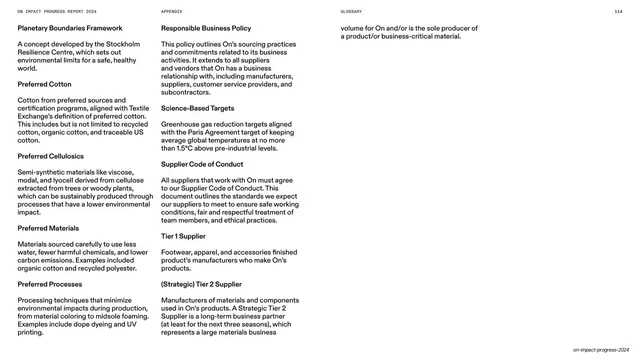


More like this

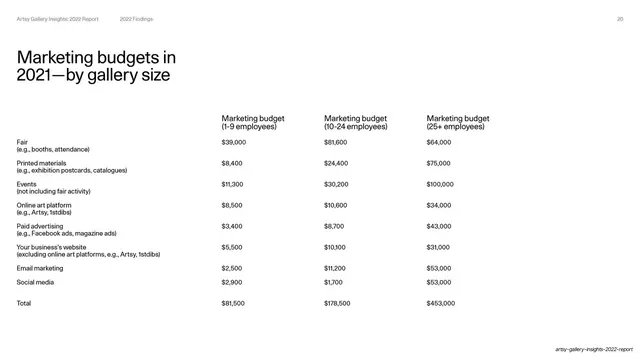
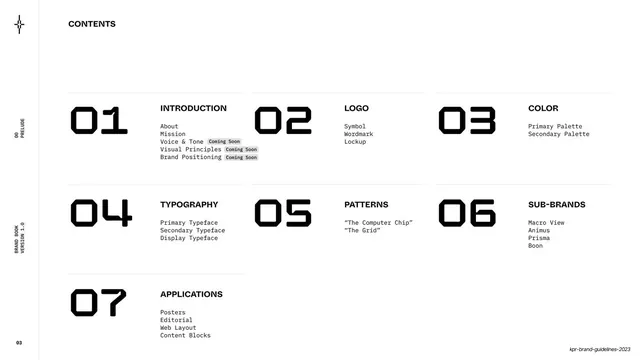




Keep what you find
A free account saves references to boards and can send you a weekly email of picks based on what you save.
To see every result, go Pro.