Preview image. Unlock full-res
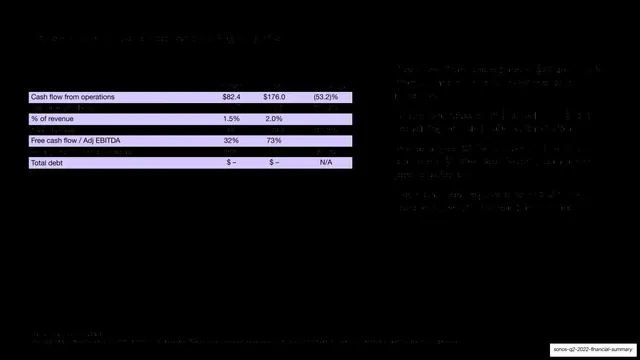
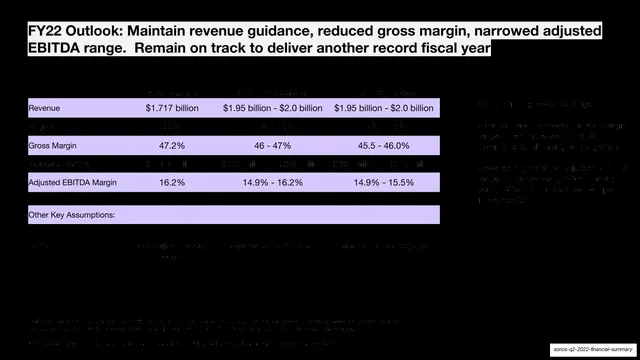
A dark slide with a compact lavender-striped cash-flow and balance-sheet table on the left and supporting commentary on the right.
Summary
A liquidity slide: a compact lavender-striped table of cash-flow and balance-sheet metrics on the left with explanatory bullets on the right.
Visual description
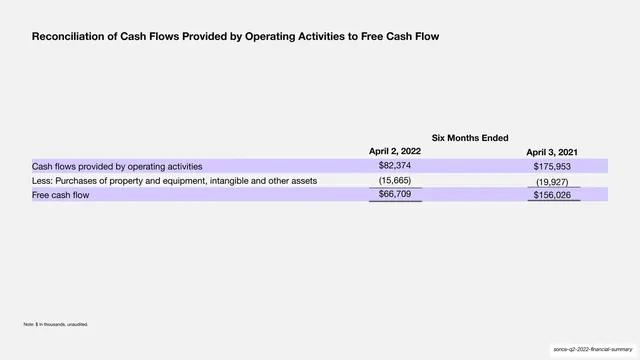
Near-black full-bleed background. A headline runs along the top. The left half holds a short financial table with key rows banded in solid pale lavender against black interstitial rows: bold white labels and figures read Cash flow from operations $82.4 / $176.0 / (53.2)%, % of revenue 1.5% / 2.0%, Free cash flow / Adj EBITDA 32% / 73%, and Total debt $ - / $ - / N/A. The right third is small bulleted commentary. The lavender bands and bold figures are legible; the lighter rows and right-hand text are low-contrast on the black ground.
Key takeaway
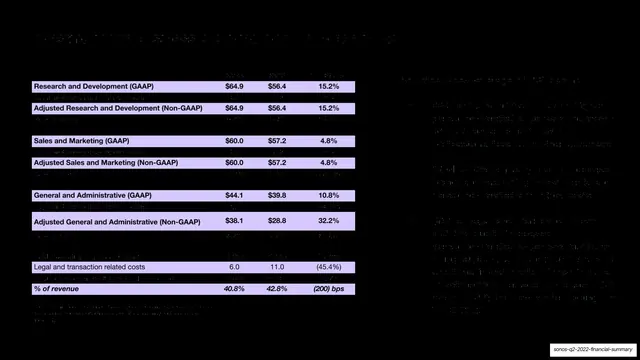
The same lavender row-banding system from the OpEx slide reused for cash flow keeps the deck's financial tables visually consistent. Highlighting the zero total-debt row in the brand band quietly turns a balance-sheet strength into a visual point.
Reuse notes
Reuse the banded-table pattern across every financial slide so the data section reads as one family. A compact four-to-five-row table like this is ideal for a liquidity snapshot. Lighten non-banded rows if used on dark for readability.
From this deck: Cash flow and balance sheet highlights
View deck









More like this






Keep what you find
A free account saves references to boards and can send you a weekly email of picks based on what you save.
To see every result, go Pro.