
Preview image. Unlock full-res
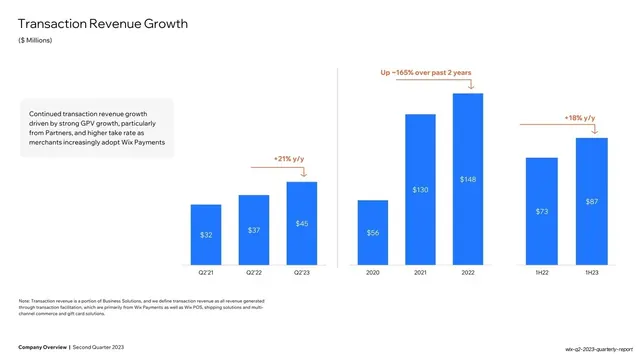
Black appendix slide with two stacked white-on-black tables detailing partners revenue and transaction revenue with y/y growth and two-year CAGR rows.
Summary
An appendix detail slide: two stacked tables on black breaking out Partners Revenue and Transaction Revenue by quarter and fiscal year, each with revenue, y/y growth, and two-year CAGR rows.
Visual description
Solid black background with white text. "Partners and Transaction Revenue" headline top-left. Two tables stack in the upper half. Each has an "in 000s" label, columns from 2021 Q2 through 2023 Q2 plus FY2020/2021/2022, and three rows: the revenue line (Partners Revenue / Transaction Revenue) set off by hairline rules, then y/y growth and 2-year CAGR percentages beneath. The lower half of the slide is empty black. Small grey notes and the bold footer sit at the bottom.
Key takeaway
Adding derived rows (y/y growth and two-year CAGR) directly beneath each revenue line in the appendix table, so the supporting detail carries the same growth framing as the headline chart slides rather than just raw figures.
Reuse notes
The closing appendix detail slide. Note the gallery caption ("Thank you for your attention") does not match this image, which is a data table, not a closing slide. Reuse the dark two-table layout for segment-level backup data. Including growth and CAGR rows makes an appendix table defensible on its own.
From this deck: Partners and Transaction Revenue appendix tables
View deck








More like this





Keep what you find
A free account saves references to boards and can send you a weekly email of picks based on what you save.
To see every result, go Pro.