Preview image. Unlock full-res
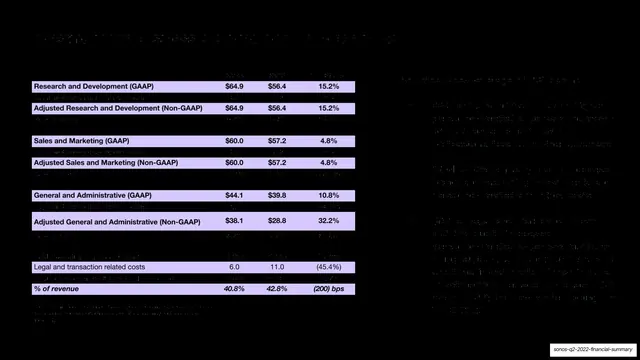
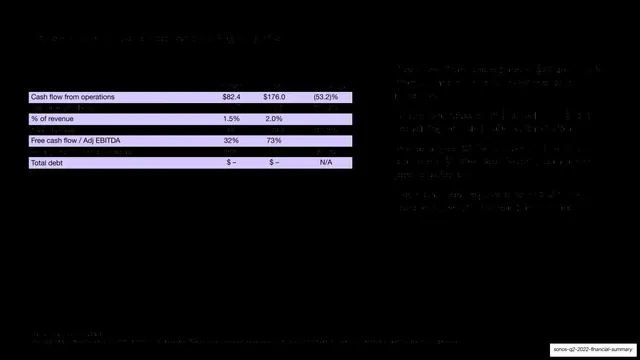
A dark slide with a lavender-striped operating-expense table on the left detailing GAAP and non-GAAP OpEx, with commentary on the right.
Summary
An operating-expense detail slide: a lavender-striped table of GAAP and adjusted OpEx line items on the left, with explanatory bullets on the right.
Visual description
Near-black full-bleed background. The left two-thirds holds a financial table whose key rows are highlighted with solid pale-lavender bands while interstitial rows stay on black, creating a strong striped rhythm. Bold white row labels and figures call out Research and Development (GAAP) $64.9 / $56.4 / 15.2%, Adjusted R&D, Sales and Marketing $60.0 / $57.2 / 4.8%, General and Administrative $44.1 / $39.8 / 10.8%, Adjusted G&A $38.1 / $28.8 / 32.2%, Legal and transaction related costs 6.0 / 11.0 / (45.4%), and a "% of revenue" 40.8% / 42.8% / (200) bps summary row. The right third is small bulleted commentary. The lavender bands and bold figures stay legible; the lighter interstitial rows and right-hand commentary are low-contrast on black.
Key takeaway
Banding only the headline rows in a solid brand color turns a dense financial table into something scannable, the lavender stripes act as built-in emphasis and a reading guide. Pairing GAAP and adjusted figures row-by-row makes the reconciliation legible at a glance.
Reuse notes
A strong template for any OpEx or P&L detail slide where you want a few rows to dominate. The solid-color row banding reads even at small sizes. On a dark ground keep the non-banded rows brighter for accessibility.
From this deck: Investing in business and OpEx leverage
View deck






More like this






Keep what you find
A free account saves references to boards and can send you a weekly email of picks based on what you save.
To see every result, go Pro.