Preview image. Unlock full-res
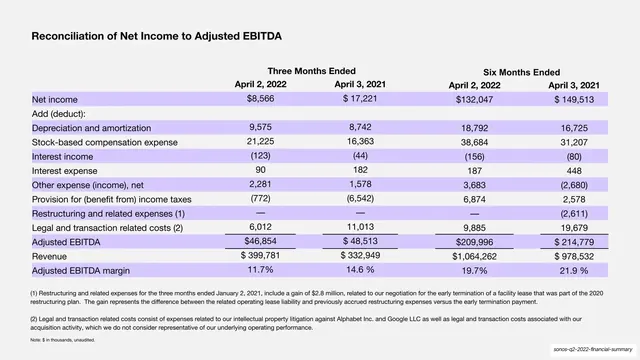
A light appendix slide with a full lavender-striped reconciliation table bridging net income to adjusted EBITDA across three- and six-month periods.
Summary
An appendix reconciliation schedule: a full lavender-striped table bridging net income to adjusted EBITDA for three- and six-month periods ended April 2022 versus April 2021.
Visual description
Light off-white full-bleed background. The heading "Reconciliation of Net Income to Adjusted EBITDA" sits top-left in black. Below, a four-figure-column table (Three Months Ended and Six Months Ended, each with April 2, 2022 and April 3, 2021) lists the bridge line items, with alternating rows banded in pale lavender for readability: Net income, Depreciation and amortization, Stock-based compensation expense, Interest income/expense, Other expense, Provision for income taxes, Restructuring, Legal and transaction costs, Adjusted EBITDA ($46,854 / $48,513 / $209,996 / $214,779), Revenue, and Adjusted EBITDA margin (11.7% / 14.6% / 19.7% / 21.9%). Two footnotes explain the restructuring and legal line items. Fully legible on the light ground.
Key takeaway
On the light appendix slides the same lavender banding reappears as zebra-striping, proving one color system can serve both the dark headline data slides and the light back-matter schedules. Full, honest reconciliation tables build investor trust; styling them in the brand keeps them on-message.
Reuse notes
A model GAAP-to-non-GAAP reconciliation schedule. Switching the data slides to a light ground for the appendix is the right call: detailed tables need maximum contrast. Reuse the lavender zebra-striping to tie the appendix back to the main deck.
From this deck: Reconciliation of net income to adjusted EBITDA
View deck







More like this




Keep what you find
A free account saves references to boards and can send you a weekly email of picks based on what you save.
To see every result, go Pro.