Preview image. Unlock full-res
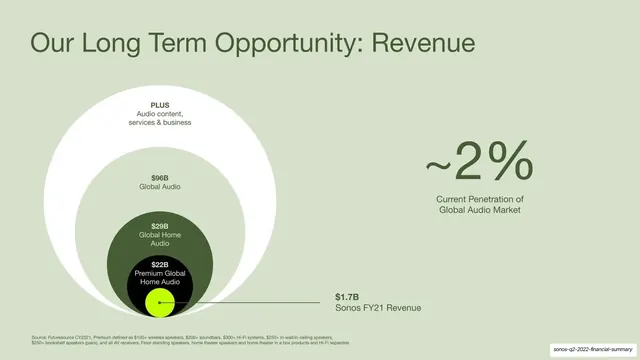
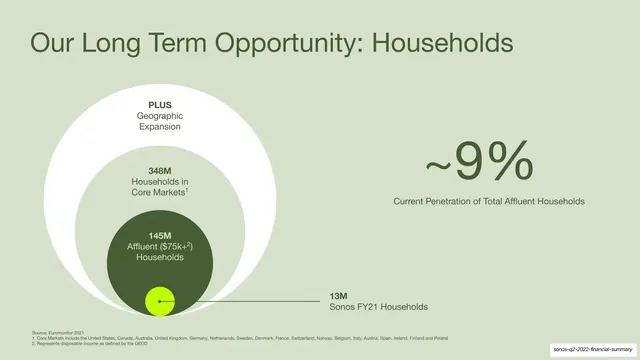
A pale-green slide using a nested-circle diagram to size the household opportunity, with a tiny lime dot marking Sonos today and a large ~9% penetration figure at right.
Summary
A market-sizing slide: a set of nested concentric circles on the left sizing the household opportunity from total to affluent to Sonos-today, with a large "~9%" penetration figure on the right.
Visual description
Pale sage-green full-bleed background. "Our Long Term Opportunity: Households" sits top-left in dark-green sans. The left half holds a nested-circle (concentric) diagram: a large white outer ring labeled "PLUS Geographic Expansion", an inner pale-green ring "348M Households in Core Markets", a solid dark-green circle "145M Affluent ($75k+) Households", and a tiny lime-green dot at the bottom edge, connected by a thin leader line to "13M Sonos FY21 Households". On the right, an oversized dark-green "~9%" sits above the caption "Current Penetration of Total Affluent Households". Small source footnotes run along the bottom.
Key takeaway
The nested-circle TAM diagram with a tiny lime dot for "us today" is the deck's smartest visual: it shows a small current position inside a vast opportunity instantly, no chart axes needed. Pairing the diagram with one oversized penetration percentage gives the eye both the picture and the headline number.
Reuse notes
An excellent, reusable way to frame TAM/SAM/SOM or any "small share of a big market" story. The lime dot trick makes the gap visceral. Keep the circle labels short and let the big percentage do the talking. Reuse the exact diagram on the next slide for revenue to build a pair.