Preview image. Unlock full-res
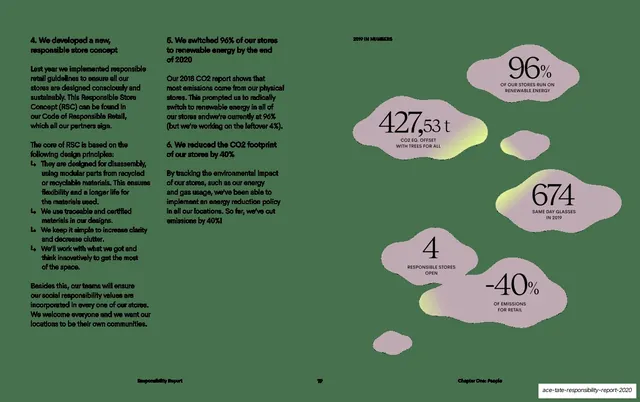
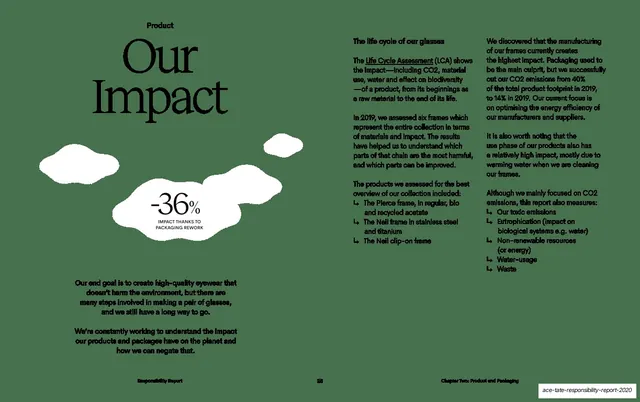
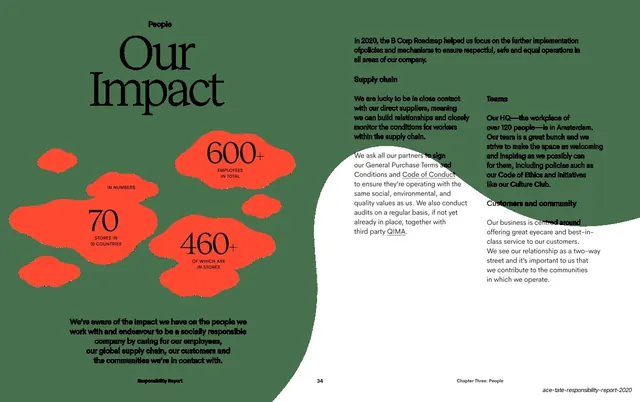
Two-column body text on the left and a cluster of mauve organic blobs on the right, each holding a serif statistic for Ace and Tate's 2019 store and emissions figures.
Summary
A text-heavy spread pairing left-aligned body copy about a responsible store concept with a loose cluster of mauve organic blobs on the right, each one carrying a large serif statistic.
Visual description
Light background. The left two-thirds holds running body copy in a small sans-serif, broken into numbered points (4, 5, 6) and indented bullet lists with arrow markers, describing a responsible store concept and CO2 reductions. The right third is a header label "2019 IN NUMBERS" above a scattered group of soft, irregular mauve-grey blobs, several tinted with a small lime-green glow at their edges. Each blob frames an oversized serif figure with an all-caps caption beneath: "96% OF OUR STORES RUN ON RENEWABLE ENERGY", "427,53 t CO2 EQ. OFFSET WITH TREES FOR ALL", "674 SAME DAY GLASSES IN 2019", "4 RESPONSIBLE STORES OPEN", "-40% OF EMISSIONS FOR RETAIL". A thin running footer reads "Responsibility Report", page 19, "Chapter One: People".
Key takeaway
Using soft organic blobs as containers for individual statistics, so a data-heavy page reads as a relaxed scatter rather than a rigid grid. The lime-green edge glow on otherwise muted mauve shapes is a quiet way to add life without adding color blocks.
Reuse notes
Good for sustainability or impact reports where numbers need to feel approachable rather than corporate. The blob-stat pattern pairs well with serif numerals and tiny all-caps labels. Needs enough whitespace around the blobs to keep them from colliding; works best when figures are short.
From this deck: Planet 2019 in numbers, blob stat cluster
View deck






More like this


Keep what you find
A free account saves references to boards and can send you a weekly email of picks based on what you save.
To see every result, go Pro.